
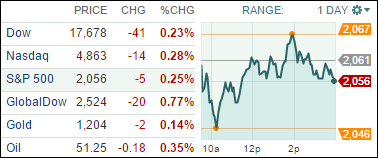
1. Moving the Markets
Stocks closed lower for the fourth day in a row. The Dow in particular has been extremely volatile this month, closing up or down more than 100 points in 14 of 18 trading sessions. This is not historically uncharacteristic of the first month of spring though. March has, for the most part, been one of the more volatile months of the first half of the year and is living up to its reputation as such. On six occasions it has posted triple-digit point gains and eight times it has undergone triple-digit point declines.
For those following the oil market, oil prices surged more than 4% on growing concerns about turmoil in the Middle East after news came in today that Saudi Arabia bombed key military installations in Yemen. The U.S. benchmark crude jumped $2.22 to close at $51.43 a barrel on the NYME. As you may well know, markets typically don’t react well to international conflict, and the plane crash in the French Alps did not help sentiment by any means.
And in further economic news, investors are still scratching their chins over Wednesday’s weak reading on February durable goods orders, a reading which raised fears that the economy may be going through a down patch and could have an adverse impact on corporate earnings, which are already under pressure due to the recent strength of the dollar.
All of our 10 ETFs in the Spotlight seesawed and closed lower, although the declines were modest. Leading the downside were consumer discretionaries (XLY) with -0.63%, while financials (IYF) fared the best with a loss of -0.19%. 5 ETFs remain on the plus side YTD after the recent pullback.
2. ETFs in the Spotlight
In case you missed the announcement and description of this section, you can read it here again.
It features 10 broadly diversified ETFs from my HighVolume list as posted every Monday. Furthermore, they are screened for the lowest MaxDD% number meaning they have been showing better resistance to temporary sell offs than all others over the past year.
Here are the 10 candidates:

The above table simply demonstrates the magnitude with which some of the ETFs are fluctuating in regards to their positions above or below their respective individual trend lines (%M/A). A break below, represented by a negative number, shows weakness, while a break above, represented by a positive percentage, shows strength.
For hundreds of ETF/Mutual fund choices, be sure to reference Thursday’s StatSheet.
Year to date, here’s how the above candidates have fared so far:
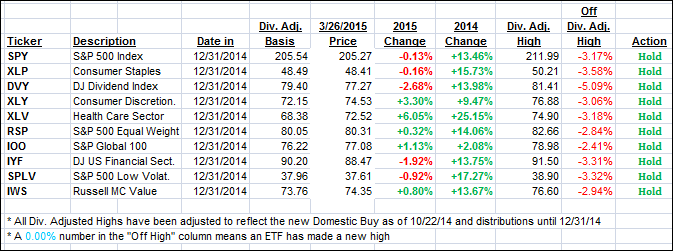
Again, the first table above shows the position of the various ETFs in relation to their respective long term trend lines (%M/A), while the second one tracks their trailing sell stops in the “Off High” column. The “Action” column will signal a “Sell” once the -7.5% point has been taken out in the “Off High” column.
3. Trend Tracking Indexes (TTIs)
Our Trend Tracking Indexes (TTIs) slipped a bit despite the S&P’s valiant attempt to close above the unchanged line. Last minute selling pulled the index back down and our TTIs followed suit.
Here’s how we closed:
Domestic TTI: +2.78% (last close +2.94%)—Buy signal effective 10/22/2014
International TTI: +3.46% (last close +4.02%)—Buy signal effective 2/13/2015
Disclosure: I am obliged to inform you that I, as well as advisory clients of mine, own some of these listed ETFs. Furthermore, they do not represent a specific investment recommendation for you, they merely show which ETFs from the universe I track are falling within the guidelines specified.
Contact Ulli