
1. Moving the Markets
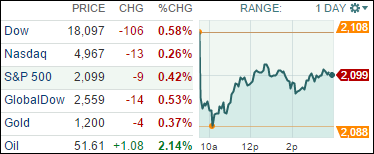
Wall Street this week is getting a mix of job-related data that will shed light on whether the stormy winter weather, West Coast port strike and continued troubles in the oil patch took a bite out of the U.S. job-creation machine in February. It is disappointing overall, given that all 3 major indexes were at record levels to start out the week.
In fast food news, McDonalds (MCD) made a move today that could influence the way chicken is produced and consumed in the U.S. The company said that over the next two years it will stop using chicken treated with antibiotics commonly used for humans. What’s the big deal you may ask? Well, antibiotic use with poultry, cattle and hogs has become a hot button issue with consumers. The result can be that germs become more drug resistant and, ultimately, the antibiotics can lose effectiveness in treating human illnesses.
In oil markets, Brent crude traded around $60 per barrel today after Saudi Arabia raised its official selling prices for its oil deliveries to Asia and the U.S. on Tuesday. In the past seven weeks, Brent crude has risen from a six-year low of around $45, despite global oversupply concerns.
9 of our 10 ETFs in the Spotlight slipped and closed lower. Bucking the trend was healthcare (XLV), which actually gained +0.48% despite the lack of upward momentum.
2. ETFs in the Spotlight
In case you missed the announcement and description of this section, you can read it here again.
It features 10 broadly diversified ETFs from my HighVolume list as posted every Monday. Furthermore, they are screened for the lowest MaxDD% number meaning they have been showing better resistance to temporary sell offs than all others over the past year.
Here are the 10 candidates:
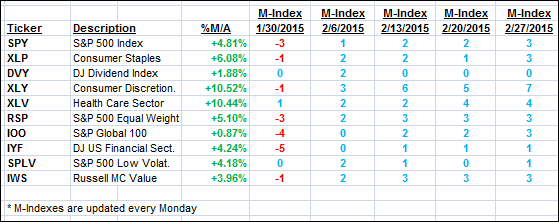
The above table simply demonstrates the magnitude with which some of the ETFs are fluctuating in regards to their positions above or below their respective individual trend lines (%M/A). A break below, represented by a negative number, shows weakness, while a break above, represented by a positive percentage, shows strength.
For hundreds of ETF/Mutual fund choices, be sure to reference Thursday’s StatSheet.
Year to date, here’s how the above candidates have fared so far:
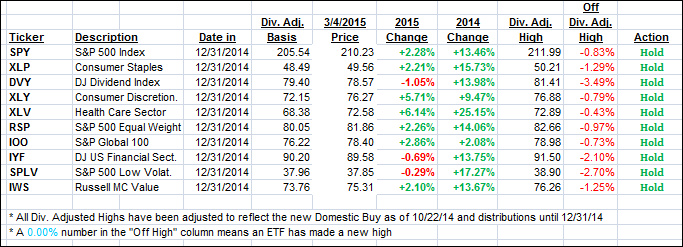
Again, the first table above shows the position of the various ETFs in relation to their respective long term trend lines (%M/A), while the second one tracks their trailing sell stops in the “Off High” column. The “Action” column will signal a “Sell” once the -7.5% point has been taken out in the “Off High” column.
3. Trend Tracking Indexes (TTIs)
Our Trend Tracking Indexes (TTIs) retreated, although by only a small margin, as the markets were trying to find some footing.
Here’s how we ended up:
Domestic TTI: +3.62% (last close +3.78%)—Buy signal effective 10/22/2014
International TTI: +3.57% (last close +3.68%)—Buy signal effective 2/13/2015
Disclosure: I am obliged to inform you that I, as well as advisory clients of mine, own some of these listed ETFs. Furthermore, they do not represent a specific investment recommendation for you, they merely show which ETFs from the universe I track are falling within the guidelines specified.
Contact Ulli