
1. Moving the Markets
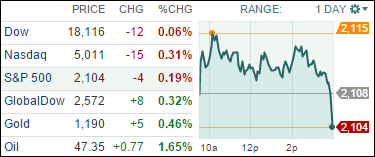
The indexes meandered throughout the trading day but were not able to sustain early upside momentum. In the last few minutes of trading, the indexes puked and finished in the red, although by only a small margin given last week’s advance.
Concern remained in the currency arena where the dollars advance has raised serious concerns about future profitability of those companies with international exposure. Even though there was some dollar pullback today, stocks did not get any support out of it.
A host of economic data is on the menu for this week, but most closely watched will be the release of the GDPs’ fourth quarter revisions coming up this Friday.
7 of our 10 ETFs in the Spotlight slipped while 3 advanced. Heading the gainers was Global 100 (IOO) with +0.38%, while the downside was lead by Financials, which gave up -0.43%.
2. ETFs in the Spotlight
In case you missed the announcement and description of this section, you can read it here again.
It features 10 broadly diversified ETFs from my HighVolume list as posted every Monday. Furthermore, they are screened for the lowest MaxDD% number meaning they have been showing better resistance to temporary sell offs than all others over the past year.
Here are the 10 candidates:
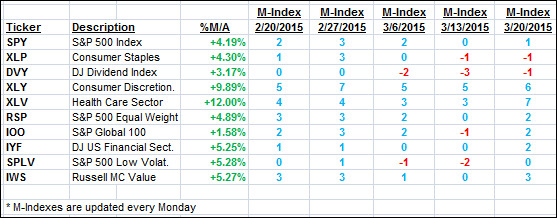
The above table simply demonstrates the magnitude with which some of the ETFs are fluctuating in regards to their positions above or below their respective individual trend lines (%M/A). A break below, represented by a negative number, shows weakness, while a break above, represented by a positive percentage, shows strength.
For hundreds of ETF/Mutual fund choices, be sure to reference Thursday’s StatSheet.
Year to date, here’s how the above candidates have fared so far:
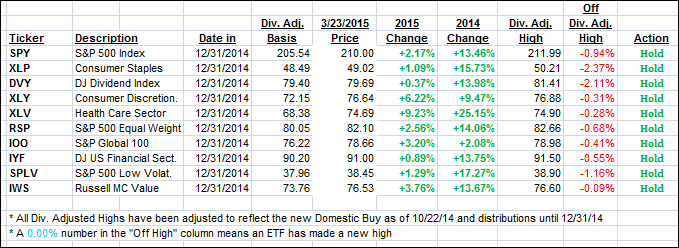
Again, the first table above shows the position of the various ETFs in relation to their respective long term trend lines (%M/A), while the second one tracks their trailing sell stops in the “Off High” column. The “Action” column will signal a “Sell” once the -7.5% point has been taken out in the “Off High” column.
3. Trend Tracking Indexes (TTIs)
Our Trend Tracking Indexes (TTIs) were mixed and changed only immaterially.
Here’s how we ended up:
Domestic TTI: +3.98% (last close +4.07%)—Buy signal effective 10/22/2014
International TTI: +5.10% (last close +4.98%)—Buy signal effective 2/13/2015
Disclosure: I am obliged to inform you that I, as well as advisory clients of mine, own some of these listed ETFs. Furthermore, they do not represent a specific investment recommendation for you, they merely show which ETFs from the universe I track are falling within the guidelines specified.
Contact Ulli