
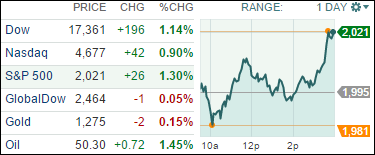
1. Moving the Markets
The first month of 2015 was not kind to stocks. Based on the S&P 500 performance, stocks were 3% lower. January has been known for setting the tone for the rest of the year, but fear not, because the markets tend to do well in February given that they have gained an average of 3.5% for the past five Februaries.
January was a big month for tech stock news, led by Apple (AAPL) reporting their largest monthly profit ever. However, there may be turbulent waters ahead for the fruit company that has $178 billion in cash and investments. The company announced a $6.5 billion debt offering Monday, but according to news reports today, the maker of electronic gadgets is already on the hook for $43 billion in total debt. Investors are keeping an eye on the leverage environment at Apple, mostly due to the fact that the purpose of the debt appears to be for financing stock buybacks and dividends.
On the flip side of energy, one of the remaining themes plaguing investors’ minds has been the price of oil. While the recent downtrend in oil prices may scare some, many analysts say that lower prices will ultimately “fuel” consumer spending and thus economic growth.
In international news, stocks in Europe were mixed, with declines in Spanish and Italian shares as Greece seeks to end its existing debt deal. Data pointed to weak January growth in euro zone factory activity.
All of our 10 ETFs in the Spotlight recuperated from last week’s sell-off and rallied late in the session. YTD, 4 of them are now showing green numbers.
2. ETFs in the Spotlight
In case you missed the announcement and description of this section, you can read it here again.
It features 10 broadly diversified ETFs from my HighVolume list as posted every Monday. Furthermore, they are screened for the lowest MaxDD% number meaning they have been showing better resistance to temporary sell offs than all others over the past year.
Here are the 10 candidates:
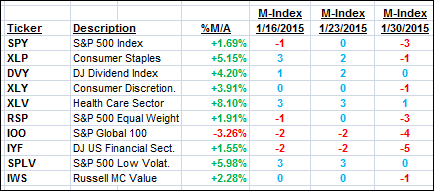
The above table simply demonstrates the magnitude with which some of the ETFs are fluctuating in regards to their positions above or below their respective individual trend lines (%M/A). A break below, represented by a negative number, shows weakness, while a break above, represented by a positive percentage, shows strength.
For hundreds of ETF/Mutual fund choices, be sure to reference Thursday’s StatSheet.
Year to date, here’s how the above candidates have fared so far:
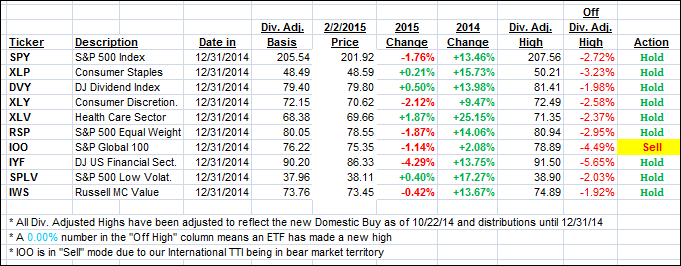
Again, the first table above shows the position of the various ETFs in relation to their respective long term trend lines (%M/A), while the second one tracks their trailing sell stops in the “Off High” column. The “Action” column will signal a “Sell” once the -7.5% point has been taken out in the “Off High” column.
3. Trend Tracking Indexes (TTIs)
Our Trend Tracking Indexes (TTIs) joined the late rally and improved their positions relative to their respective long-term trend lines.
Here’s how we ended up after this volatile session:
Domestic TTI: +2.55% (last close +2.02%)—Buy signal since 10/22/2014
International TTI: -0.16% (last close -0.97%)—Sell signal effective 12/15/14
Disclosure: I am obliged to inform you that I, as well as advisory clients of mine, own some of these listed ETFs. Furthermore, they do not represent a specific investment recommendation for you, they merely show which ETFs from the universe I track are falling within the guidelines specified.
Contact Ulli