
1. Moving the Markets
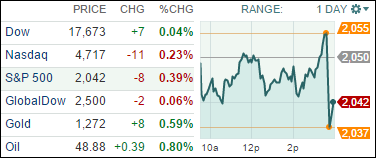
Stocks closed mixed in volatile trading as oil prices broke a four-day rally and plunged almost 9%. In addition, investors pulled back amid concerns over a mixed batch of economic and earnings reports and news that the European Central Bank lifted a waiver on using Greek debt as collateral.
Crude oil’s four-day, 20% move hit a slick spot, ending a brief rally in oil stocks. West Texas Intermediate crude, which recently jumped 7% to close above $50 a barrel for the first time in weeks, fell 8.7% back down to $48.45 a barrel. The slide on the day, which was the largest since November, came after the U.S. Energy Information Administration said crude supplies rose to more than 413 million barrels last week. That’s the highest level for January in more than 80 years.
Over the past six trading days, the market has gone up and down via three gains and three losses. Analysts are saying that the volatility is tied to uncertainty over corporate earnings, falling oil prices and a stronger dollar, which has pinched companies’ profits and forced investors to second-guess their expectations.
While the week began well, it shall be interesting to see how it wraps up on Thursday and Friday.
Our 10 ETFs in the Spotlight were mixed with only 2 of them gaining on the day, however, one of them made a new yearly high as you can see in section 2.
2. ETFs in the Spotlight
In case you missed the announcement and description of this section, you can read it here again.
It features 10 broadly diversified ETFs from my HighVolume list as posted every Monday. Furthermore, they are screened for the lowest MaxDD% number meaning they have been showing better resistance to temporary sell offs than all others over the past year.
Here are the 10 candidates:
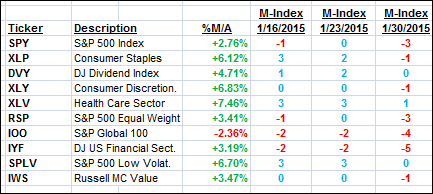
The above table simply demonstrates the magnitude with which some of the ETFs are fluctuating in regards to their positions above or below their respective individual trend lines (%M/A). A break below, represented by a negative number, shows weakness, while a break above, represented by a positive percentage, shows strength.
For hundreds of ETF/Mutual fund choices, be sure to reference Thursday’s StatSheet.
Year to date, here’s how the above candidates have fared so far:
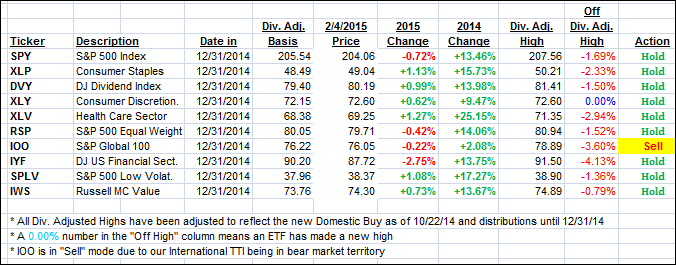
Again, the first table above shows the position of the various ETFs in relation to their respective long term trend lines (%M/A), while the second one tracks their trailing sell stops in the “Off High” column. The “Action” column will signal a “Sell” once the -7.5% point has been taken out in the “Off High” column.
3. Trend Tracking Indexes (TTIs)
Our Trend Tracking Indexes (TTIs) slipped at tad; I will still watch the International one for a few days to see if it holds above its recently conquered level on the bullish side of the trend line.
Here’s how we closed:
Domestic TTI: +2.92% (last close +3.05%)—Buy signal since 10/22/2014
International TTI: +0.90% (last close +0.96%)—Sell signal effective 12/15/14
Disclosure: I am obliged to inform you that I, as well as advisory clients of mine, own some of these listed ETFs. Furthermore, they do not represent a specific investment recommendation for you, they merely show which ETFs from the universe I track are falling within the guidelines specified.
Contact Ulli
Comments 2
Hi Ulli,
I was just wondering why you don’t have a diversified REIT, such as VNQ, in your broadly diversified ETFs that you track/recommend.
Chuck,
When I scanned through the ETF criteria for those to be included on the “ETFs in the Spotlight” list, none of the REITs made the cut. That does not mean they are not a viable investment option, it merely means that they did fulfill the requirement to make it on this particular list.
Ulli…