
1. Moving the Markets
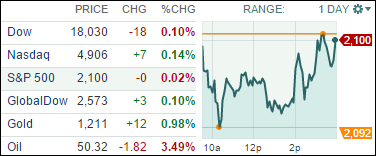
It was a wild ride, but in the end nothing was gained as the S&P 500 closed about unchanged. The struggle occurred mid-day as the Fed minutes were released, which emphasized that, despite much jawboning to the contrary in the recent past, a premature rate hike “would harm the economy.” So, who knows when the inevitable rise will actually occur…
While the initial reaction was a sharp spike as lower rates for a longer period seem to be always welcome, a sell-off ensued, which was promptly reversed as we closed near the highs of the day. In other words, confusion reigned.
Economic reports were disappointing, which has been an ongoing theme lately, although you would not know it by the elevated level of the market indexes. Other non-inspiring news was the continued stalemate between Greece and its creditors along with the continued crisis in the Ukraine.
8 our 10 ETFs in the Spotlight closed up with 4 of them again making new highs; 9 of them are now on the plus side YTD.
2. ETFs in the Spotlight
In case you missed the announcement and description of this section, you can read it here again.
It features 10 broadly diversified ETFs from my HighVolume list as posted every Monday. Furthermore, they are screened for the lowest MaxDD% number meaning they have been showing better resistance to temporary sell offs than all others over the past year.
Here are the 10 candidates:
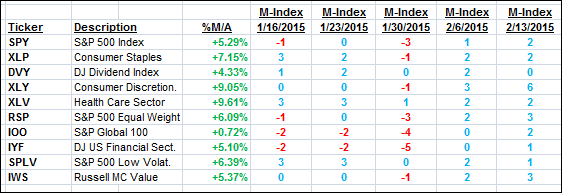
The above table simply demonstrates the magnitude with which some of the ETFs are fluctuating in regards to their positions above or below their respective individual trend lines (%M/A). A break below, represented by a negative number, shows weakness, while a break above, represented by a positive percentage, shows strength.
For hundreds of ETF/Mutual fund choices, be sure to reference Thursday’s StatSheet.
Year to date, here’s how the above candidates have fared so far:
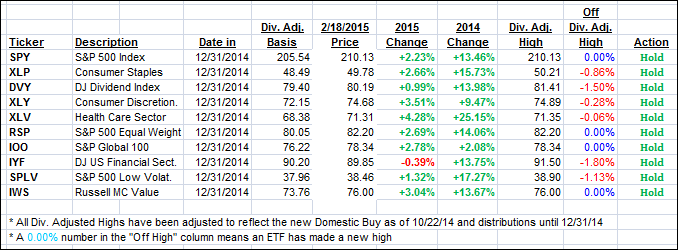
Again, the first table above shows the position of the various ETFs in relation to their respective long term trend lines (%M/A), while the second one tracks their trailing sell stops in the “Off High” column. The “Action” column will signal a “Sell” once the -7.5% point has been taken out in the “Off High” column.
3. Trend Tracking Indexes (TTIs)
Our Trend Tracking Indexes (TTIs) improved by moving deeper into bullish territory.
Here’s how we ended this day:
Domestic TTI: +3.74% (last close +3.57%)—Buy signal effective 10/22/2014
International TTI: +3.12% (last close +2.60%)—Buy signal effective 2/13/2015
Disclosure: I am obliged to inform you that I, as well as advisory clients of mine, own some of these listed ETFs. Furthermore, they do not represent a specific investment recommendation for you, they merely show which ETFs from the universe I track are falling within the guidelines specified.
Contact Ulli