
1. Moving the Markets
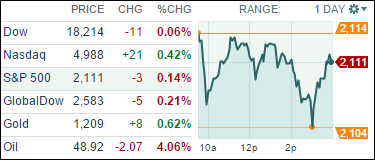
After a gang-buster month, it’s no surprise to see the markets meander a bit before the last trading day of February arrives tomorrow. Barring any major sell-off, the Dow and S&P 500 are on track for their best monthly performance in more than 3 years.
Falling oil prices put the energy sector in the negative while healthcare for the most part manage to eke out a gain. Apple (AAPL) was able to reverse an early slide and close up 1.26% on a widely anticipated media event scheduled for March 9th.
8 our 10 ETFs in the Spotlight slipped during this roller-coaster day, 2 gained with 1 of them making a new high.
2. ETFs in the Spotlight
In case you missed the announcement and description of this section, you can read it here again.
It features 10 broadly diversified ETFs from my HighVolume list as posted every Monday. Furthermore, they are screened for the lowest MaxDD% number meaning they have been showing better resistance to temporary sell offs than all others over the past year.
Here are the 10 candidates:
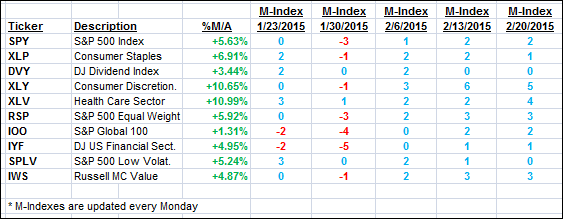
The above table simply demonstrates the magnitude with which some of the ETFs are fluctuating in regards to their positions above or below their respective individual trend lines (%M/A). A break below, represented by a negative number, shows weakness, while a break above, represented by a positive percentage, shows strength.
For hundreds of ETF/Mutual fund choices, be sure to reference Thursday’s StatSheet.
Year to date, here’s how the above candidates have fared so far:
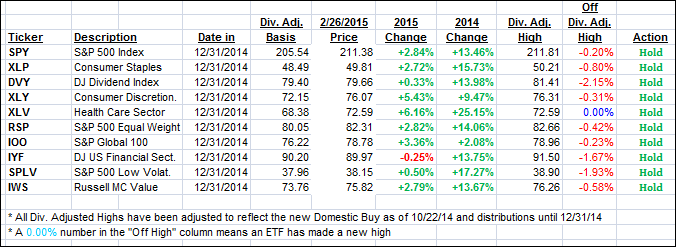
Again, the first table above shows the position of the various ETFs in relation to their respective long term trend lines (%M/A), while the second one tracks their trailing sell stops in the “Off High” column. The “Action” column will signal a “Sell” once the -7.5% point has been taken out in the “Off High” column.
3. Trend Tracking Indexes (TTIs)
Our Trend Tracking Indexes (TTIs) pulled back a tad as the major indexes slowed from their torrid pace of the month.
Here’s how we ended up:
Domestic TTI: +4.18% (last close +4.26%)—Buy signal effective 10/22/2014
International TTI: +4.05% (last close +4.29%)—Buy signal effective 2/13/2015
Disclosure: I am obliged to inform you that I, as well as advisory clients of mine, own some of these listed ETFs. Furthermore, they do not represent a specific investment recommendation for you, they merely show which ETFs from the universe I track are falling within the guidelines specified.
Contact Ulli