
1. Moving the Markets
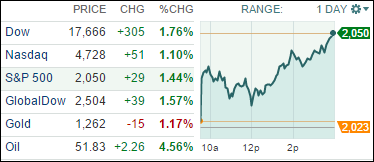
February is so far proving to be a healthy antidote to a dismal start to 2015. The market gains continued today on top of Monday’s strong rally as the Dow jumped almost 200 points, putting its two-day total to 501 points. That’s the best two-day gain for the blue-chip index since Jan. 7-8.
Oil prices were a big focus today. Prices on the U.S. market surged as much as 7%, to close at $53.05 a barrel in New York. After a seven-month drop of more than 50%, speculation is rife that oil prices might have found the “bottom of the barrel” so to speak and thus may be moving towards a price increase. Of course, energy stocks such as Exxon-Mobil (XOM) and Chevron (CVX) posted big gains today.
We heard some good news from Europe today. Hopes for a deal between Greece and its European creditors got a boost after the country’s new government backed away from demands to write off a chunk of its bailout loans, a prospect that had horrified creditors and investors. Greek stocks led a European market rally therafter. The Athens stock exchange rose as Greek bond yields eased, which is a sign investors are less worried about default. The Euro Stoxx index gained nearly 1%.
All of our 10 ETFs in the Spotlight joined the party and closed higher with XLY leading the group sporting a +2.12% gain. 7 of these ETFs have now marched into positive territory YTD as the table in section 2 shows.
2. ETFs in the Spotlight
In case you missed the announcement and description of this section, you can read it here again.
It features 10 broadly diversified ETFs from my HighVolume list as posted every Monday. Furthermore, they are screened for the lowest MaxDD% number meaning they have been showing better resistance to temporary sell offs than all others over the past year.
Here are the 10 candidates:
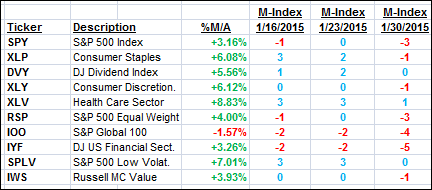
The above table simply demonstrates the magnitude with which some of the ETFs are fluctuating in regards to their positions above or below their respective individual trend lines (%M/A). A break below, represented by a negative number, shows weakness, while a break above, represented by a positive percentage, shows strength.
For hundreds of ETF/Mutual fund choices, be sure to reference Thursday’s StatSheet.
Year to date, here’s how the above candidates have fared so far:
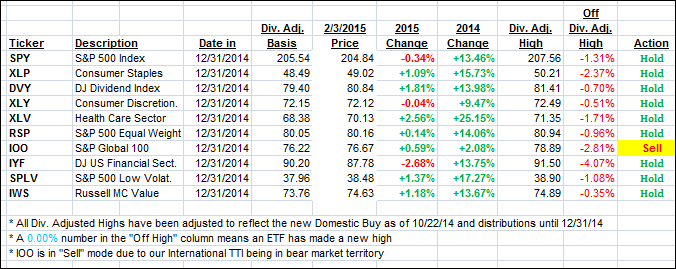
Again, the first table above shows the position of the various ETFs in relation to their respective long term trend lines (%M/A), while the second one tracks their trailing sell stops in the “Off High” column. The “Action” column will signal a “Sell” once the -7.5% point has been taken out in the “Off High” column.
3. Trend Tracking Indexes (TTIs)
Our Trend Tracking Indexes (TTIs) improved by moving deeper into bullish territory. The International one crossed its trend line to the upside for the first time in a while. To avoid a potential whipsaw signal, I will wait a few days to see if this break above has staying power before declaring a new Buy cycle.
Here’s how we ended up:
Domestic TTI: +3.05% (last close +2.55%)—Buy signal since 10/22/2014
International TTI: +0.96% (last close -0.16%)—Sell signal effective 12/15/14
Disclosure: I am obliged to inform you that I, as well as advisory clients of mine, own some of these listed ETFs. Furthermore, they do not represent a specific investment recommendation for you, they merely show which ETFs from the universe I track are falling within the guidelines specified.
Contact Ulli