
1. Moving the Markets
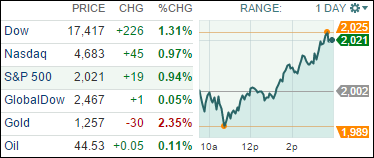
Stocks staged a strong afternoon rally and closed higher today as the major indexes broke a two-day losing streak. Utilities led the way for the S&P 500, as all ten sectors of the index posted gains.
In tech news, shares of Alibaba (BABA) plunged 8.5% after the Chinese Internet giant reported revenue that fell short of analyst expectations. The company is also dealing with a report from the Chinese government that said it allowed the sales of fake goods on its e-commerce platforms, however, there is much that is still to be determined. Google Inc.’s (GOOG) fourth-quarter sales and profit missed estimates as the Web Company’s advertising business faced more competition on mobile devices.
Continuing in the world of internet, Time Warner Cable (TWX) continued to lose cable subscribers in the three months ended in December as Americans experiment with cutting the cord to their cable. Perhaps mobile TV and streaming is the way of the future. However, the cable giant is not willing to give up by any means.
In economic news, the Fed strengthened its assessment of the U.S. economy Wednesday, noting it is expanding at a solid pace and generating strong job growth. The central bank also indicated it would remain “patient” in raising interest rates from near zero, which was expected.
All of our 10 ETFs in the Spotlight managed to follow newly found upside momentum and closed higher with XLY leading the charge with a +1.36% gain. YTD, 4 of the 10 remain on the plus side as you can see in section 2.
2. ETFs in the Spotlight
In case you missed the announcement and description of this section, you can read it here again.
It features 10 broadly diversified ETFs from my HighVolume list as posted every Monday. Furthermore, they are screened for the lowest MaxDD% number meaning they have been showing better resistance to temporary sell offs than all others over the past year.
Here are the 10 candidates:
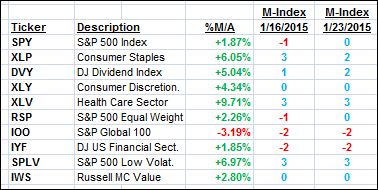
The above table simply demonstrates the magnitude with which some of the ETFs are fluctuating in regards to their positions above or below their respective individual trend lines (%M/A). A break below, represented by a negative number, shows weakness, while a break above, represented by a positive percentage, shows strength.
For hundreds more ETF/Mutual fund choices, be sure to reference Thursday’s StatSheet.
Year to date, here’s how the above candidates have fared so far:
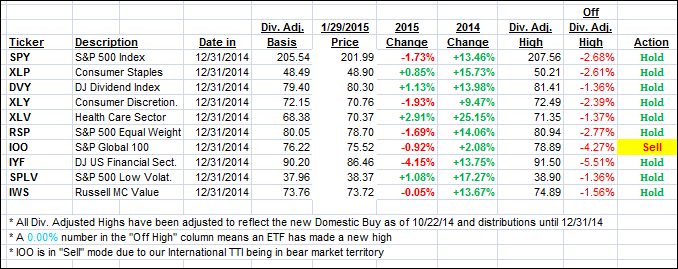
Again, the first table above shows the position of the various ETFs in relation to their respective long term trend lines (%M/A), while the second one tracks their trailing sell stops in the “Off High” column. The “Action” column will signal a “Sell” once the -7.5% point has been taken out in the “Off High” column.
3. Trend Tracking Indexes (TTIs)
Our Trend Tracking Indexes (TTIs) recovered and ended this day on a positive note:
Domestic TTI: +2.53% (last close +2.17%)—Buy signal since 10/22/2014
International TTI: -0.26% (last close -0.72%)—Sell signal effective 12/15/14
Disclosure: I am obliged to inform you that I, as well as advisory clients of mine, own some of these listed ETFs. Furthermore, they do not represent a specific investment recommendation for you, they merely show which ETFs from the universe I track are falling within the guidelines specified.
Contact Ulli