
1. Moving the Markets
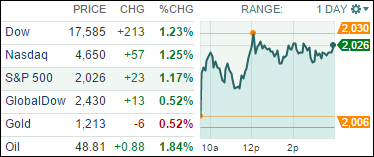
If you read yesterday’s article, you may remember that I mentioned the Dow has dropped 500 points in the last two days. Well, today the Dow regained 200 points as all major indexes rallied more than 1.15%.
The Fed minutes release of their last month’s meeting was the main driver that pushed markets higher today. The minutes from the Dec. 16-17 meeting noted that the U.S. central bank said economic weakness abroad posed a “downside risk” to the U.S. economy, but was quick to shrug off those worries because they expect more stringent further reponses from foreign central banks to help jumpstart Eurozone growth. In closing, the minutes also reemphasized that they will remain patient regarding interest rate hikes later this year.
Declining oil prices have been all over the news during the past two months, but today prices bounced back, snapping a four-day losing streak. Exxon Mobil Corp (XOM) shares rose 1% to $90.72.
Shares of Dick’s Sporting Goods Inc (DKS) gained 11.7% today to close at $55.01 a share. According to Reuters, people familiar with the matter said the company is holding early-stage conversations with a handful of buyout firms about going private.
All of our 10 ETFs in the Spotlight joined the reversal and closed higher with healthcare (XLV) being the clear winner with a gain of +2.35% for the day.
2. ETFs in the Spotlight
In case you missed the announcement and description of this section, you can read it here again.
It features 10 broadly diversified ETFs from my HighVolume list as posted every Monday. Furthermore, they are screened for the lowest MaxDD% number meaning they have been showing better resistance to temporary sell offs than all others over the past year.
Here are the 10 candidates:
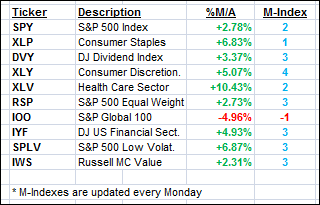
The above table simply demonstrates the magnitude with which some of the ETFs are fluctuating in regards to their positions above or below their respective individual trend lines (%M/A). A break below, represented by a negative number, shows weakness, while a break above, represented by a positive percentage, shows strength.
Year to date, here’s how the above candidates have fared so far:
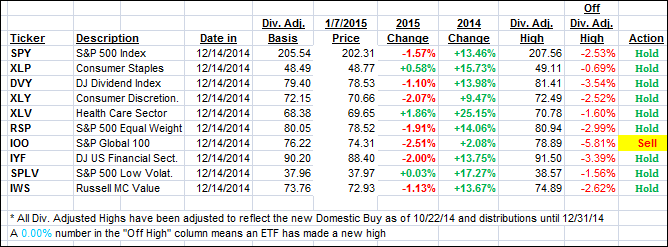
Again, the first table above shows the position of the various ETFs in relation to their respective long term trend lines (%M/A), while the second one tracks their trailing sell stops in the “Off High” column. The “Action” column will signal a “Sell” once the -7.5% point has been taken out in the “Off High” column.
3. Trend Tracking Indexes (TTIs)
Our Trend Tracking Indexes (TTIs) improved, however, the International one remains south of its trend line and therefore in bear market territory:
Here’s how we ended this day:
Domestic TTI: +2.07% (last close +1.52%)—Buy signal since 10/22/2014
International TTI: -3.02% (last close -3.61%)—New Sell signal effective 12/15/14
Disclosure: I am obliged to inform you that I, as well as advisory clients of mine, own some of these listed ETFs. Furthermore, they do not represent a specific investment recommendation for you, they merely show which ETFs from the universe I track are falling within the guidelines specified.
Contact Ulli