
1. Moving the Markets
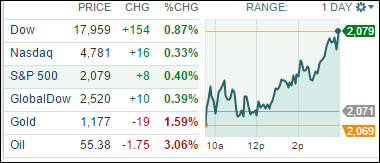
Despite a slow start, the major indexes picked up steam during mid-day with the Dow and S&P 500 closing at record levels—again. The theme that the Fed won’t be raising rates at anytime soon proved to be the driver for today’s session.
This was the fourth straight day of gains, since Fed chair Yellen uttered Wall Street’s favorite word in regards to the timing and speed of any rate hikes, namely “patience.” Let’s see how long this word works its magic before it needs to be replaced by a new one.
Economic data were mixed with existing home sales taking a beating during November, as they slowed down to their weakest pace in 6 months. Offsetting this negative was a report on economic growth from the Chicago Fed that was stronger than expected.
9 of our 10 ETFs in the Spotlight participated in the upward momentum and closed up; 5 of them made new highs as table 3 below shows.
2. ETFs in the Spotlight
In case you missed the announcement and description of this section, you can read it here again.
It features 10 broadly diversified ETFs from my HighVolume list as posted every Monday. Furthermore, they are screened for the lowest MaxDD% number meaning they have been showing better resistance to temporary sell offs than all others over the past year.
Here are the 10 candidates:
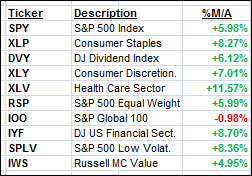
The above table simply demonstrates the magnitude with which some of the ETFs are fluctuating in regards to their positions above or below their respective individual trend lines (%M/A). A break below, represented by a negative number, shows weakness, while a break above, represented by a positive percentage, shows strength.
Year to date, here’s how the above candidates have fared so far:
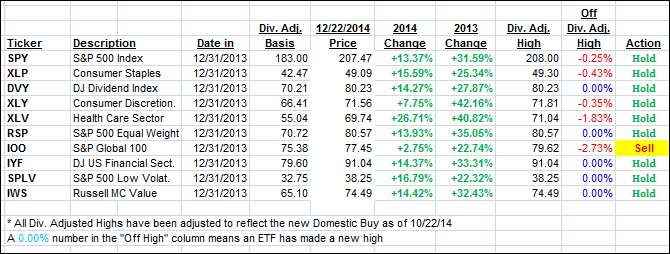
Again, the first table above shows the position of the various ETFs in relation to their respective long term trend lines (%M/A), while the second one tracks their trailing sell stops in the “Off High” column. The “Action” column will signal a “Sell” once the -7.5% point has been taken out in the “Off High” column.
3. Trend Tracking Indexes (TTIs)
Our Trend Tracking Indexes (TTIs) rallied slightly with the International one barely crawling above its long-term trend line. In order to avoid a potential whip-saw signal, I will wait before issuing a new “Buy” for that area until we get more confirmation that this turnaround in fact has legs.
Here’s how we ended this day:
Domestic TTI: +3.31% (last close +3.21%)—Buy signal since 10/22/2014
International TTI: +0.04% (last close -0.20%)—New Sell signal effective 12/15/14
Disclosure: I am obliged to inform you that I, as well as advisory clients of mine, own some of these listed ETFs. Furthermore, they do not represent a specific investment recommendation for you, they merely show which ETFs from the universe I track are falling within the guidelines specified.
Contact Ulli