
1. Moving the Markets
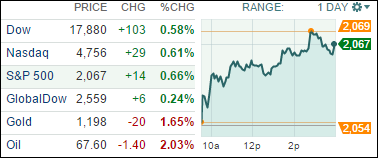
All major indexes gained today after a lethargic trading session on Monday. Again, the Dow hit a new record close as all three major indexes gained about 0.6% today.
Over the past couple of weeks, we have seen energy stocks take a big hit due to falling oil prices. However, oil stocks were big gainers for the Dow on Tuesday. Exxon Mobile (XOM), British Petroleum (BP) and Chevron (CVX) all gained more than 2% today, even though oil prices fell another 3%. According to Reuters, much of what drove oil stocks higher today was due to a rumored potential takeover bid of BP from Shell.
We heard some positive economic news today as well: Newly built homes and schools boosted construction spending in October to the highest level since May. The Commerce Department said construction spending rose 1.1% in October, after having slipped 0.1% in September. This news bodes well for the bulls going into the holiday season.
And in retail news, Cyber Monday proved just as big a draw as ever after a weekend that saw fewer people shopping in stores. Sales grew 8.5% for the 24-hour period, according to IBM Digital Analytics, solidifying Monday as the largest online shopping day of the year. Shoppers spent an average of $124.21 per order, down 3.5% from last year, though the number of transactions was up and people bought more items on average per order
All of our 10 ETFs in the Spotlight recovered from yesterday’s sell-off and closed up with 4 of them making new highs. See the YTD table for details.
2. ETFs in the Spotlight
In case you missed the announcement and description of this section, you can read it here again.
It features 10 broadly diversified ETFs from my HighVolume list as posted every Monday. Furthermore, they are screened for the lowest MaxDD% number meaning they have been showing better resistance to temporary sell offs than all others over the past year.
Here are the 10 candidates:
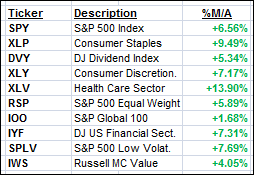
The above table simply demonstrates the magnitude with which some of the ETFs are fluctuating in regards to their positions above or below their respective individual trend lines (%M/A). A break below, represented by a negative number, shows weakness, while a break above, represented by a positive percentage, shows strength.
Year to date, here’s how the above candidates have fared so far:
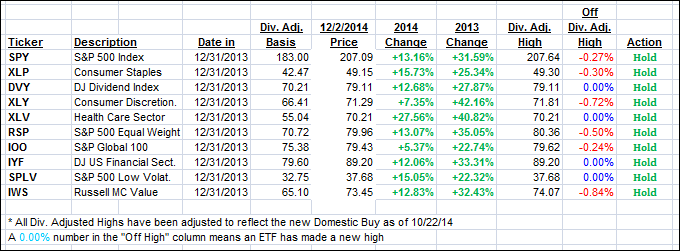
Again, the first table above shows the position of the various ETFs in relation to their respective long term trend lines (%M/A), while the second one tracks their trailing sell stops in the “Off High” column. The “Action” column will signal a “Sell” once the -7.5% point has been taken out in the “Off High” column.
3. Trend Tracking Indexes (TTIs)
Our Trend Tracking Indexes (TTIs) improved and settled deeper on the bullish side of their respective trend lines.
Here’s how we ended up:
Domestic TTI: +3.39% (last close +3.19%)—Buy signal since 10/22/2014
International TTI: +1.36% (last close +1.07%)—New Buy signal effective 11/24/14
Disclosure: I am obliged to inform you that I, as well as advisory clients of mine, own some of these listed ETFs. Furthermore, they do not represent a specific investment recommendation for you, they merely show which ETFs from the universe I track are falling within the guidelines specified.
Contact Ulli