
1. Moving the Markets
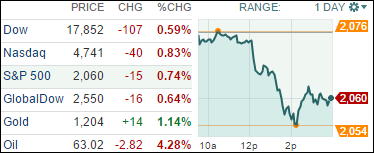
U.S. stocks dropped on Monday with the Dow stumbling more than 100 points. The S&P 500 retreated more than 0.8% and the Nasdaq gave back more than 0.7%. Falling oil prices were the culprit that dragged down the energy sector. U.S. crude fell more than 4% to close the day at $63.05 a barrel. Chevron (CVX) and ExxonMobil (XOM) were two of the biggest decliners in the Dow. Chevron dropped 3.8% to $106.70 and ExxonMobil fell 2.3% to $91.69.
More evidence of slowing growth in East Asia also raised concerns for investors today, mostly about global demand for manufactured goods, shown by weak trade data from China and news that Japan’s recession may be more serious than initially presumed. Chinese stocks surged on the news though because holders of mainland China stocks are betting on increased government stimulus.
On the upside, shares of Cubist Pharmaceuticals (CBST) blasted up 35% today today and passed the $100/share mark after Merck (MRK) announced that it will be acquiring Cubist for $102/share.
With little exciting economic news ahead this week, I can only hope that the markets will shrug off this slow start to the week and get back on their bulls to charge ahead.
3 of our 10 ETFs in the Spotlight bucked the trend and inched higher today; all 3 of them made new highs as the YTD table below shows.
2. ETFs in the Spotlight
In case you missed the announcement and description of this section, you can read it here again.
It features 10 broadly diversified ETFs from my HighVolume list as posted every Monday. Furthermore, they are screened for the lowest MaxDD% number meaning they have been showing better resistance to temporary sell offs than all others over the past year.
Here are the 10 candidates:
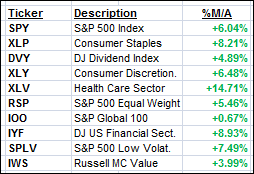
The above table simply demonstrates the magnitude with which some of the ETFs are fluctuating in regards to their positions above or below their respective individual trend lines (%M/A). A break below, represented by a negative number, shows weakness, while a break above, represented by a positive percentage, shows strength.
For additional ETF selections please review my weekly StatSheet, which is updated and posted every Thursday night.
Year to date, here’s how the above candidates have fared so far:
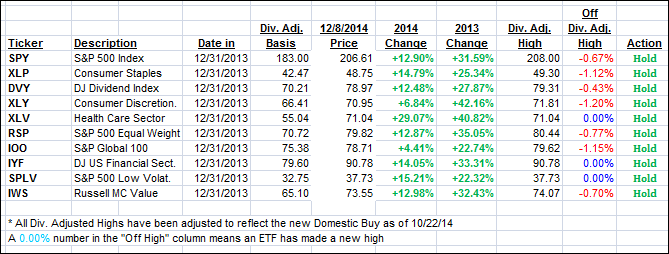
Again, the first table above shows the position of the various ETFs in relation to their respective long term trend lines (%M/A), while the second one tracks their trailing sell stops in the “Off High” column. The “Action” column will signal a “Sell” once the -7.5% point has been taken out in the “Off High” column.
3. Trend Tracking Indexes (TTIs)
Our Trend Tracking Indexes (TTIs) followed the downward momentum and closed lower:
Domestic TTI: +2.98% (last close +3.46%)—Buy signal since 10/22/2014
International TTI: +1.00% (last close +1.62%)—New Buy signal effective 11/24/14
Disclosure: I am obliged to inform you that I, as well as advisory clients of mine, own some of these listed ETFs. Furthermore, they do not represent a specific investment recommendation for you, they merely show which ETFs from the universe I track are falling within the guidelines specified.
Contact Ulli