
1. Moving the Markets
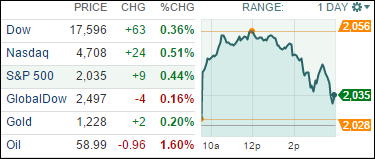
As the chart above clearly shows, the major indexes went off to races right at the opening as upbeat, although severely seasonally adjusted, retail sales figures lead the way to a sharp rebound rally overcoming yesterday’s bearish tendencies.
Hope for a strengthening economy based on optimism that the consumer had not died yet, the S&P 500 hit an intra-day high of 2,056 before reality set in that all may not be well and south we went. However, the day was saved by the indexes managing to close above the unchanged line.
The culprit unraveling this nice morning rally was Crude Oil, which fell below $60 for the first time in five years. Sure, while we all enjoy lower prices at the pump, the energy sector as a whole appears in trouble as any asset would that drops 40% in just a few months.
Not helping matters and adding to market uncertainty was concern that the $1.1 trillion spending bill may face serious objections and may not pass as was widely expected.
All of our 10 ETFs in the Spotlight gained but no new Highs were made.
2. ETFs in the Spotlight
In case you missed the announcement and description of this section, you can read it here again.
It features 10 broadly diversified ETFs from my HighVolume list as posted every Monday. Furthermore, they are screened for the lowest MaxDD% number meaning they have been showing better resistance to temporary sell offs than all others over the past year.
Here are the 10 candidates:
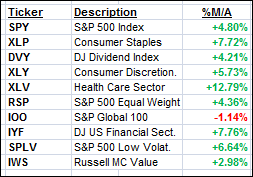
The above table simply demonstrates the magnitude with which some of the ETFs are fluctuating in regards to their positions above or below their respective individual trend lines (%M/A). A break below, represented by a negative number, shows weakness, while a break above, represented by a positive percentage, shows strength.
For additional ETF selections please review my weekly StatSheet, which is updated and posted every Thursday night.
Year to date, here’s how the above candidates have fared so far:
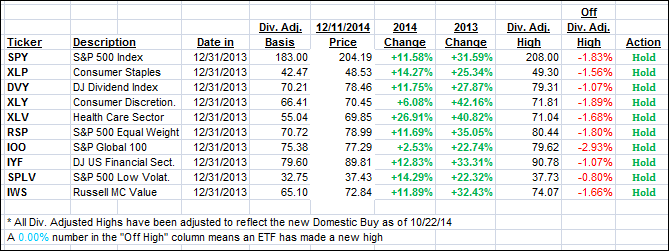
Again, the first table above shows the position of the various ETFs in relation to their respective long term trend lines (%M/A), while the second one tracks their trailing sell stops in the “Off High” column. The “Action” column will signal a “Sell” once the -7.5% point has been taken out in the “Off High” column.
3. Trend Tracking Indexes (TTIs)
Our Trend Tracking Indexes (TTIs) both improved but the International one still remains slightly below its trend line. As posted before, I will wait a few days for more downside confirmation before declaring this short Buy cycle to be over.
Here’s how we ended up:
Domestic TTI: +2.54% (last close +2.39%)—Buy signal since 10/22/2014
International TTI: -0.41% (last close -0.47%)—New Buy signal effective 11/24/14
Disclosure: I am obliged to inform you that I, as well as advisory clients of mine, own some of these listed ETFs. Furthermore, they do not represent a specific investment recommendation for you, they merely show which ETFs from the universe I track are falling within the guidelines specified.
Contact Ulli