
1. Moving the Markets
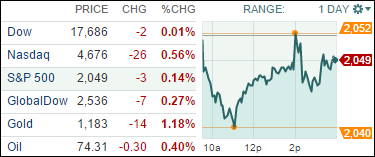
Stocks slipped into negative territory today, driven lower by the latest release of the Fed Minutes. The minutes showed that some Fed policymakers favored eliminating a pledge to keep interest rates near zero “for a considerable time” but others worried that such a move could prompt financial markets to push up rates prematurely. The major indexes pulled back slightly, as the chart above shows.
There was a notable amount of buzz today regarding speculation as to whether or not the S&P 500 can reach the 2,100 mark by the end of the year. At present, the index is just 52 points away, and many analysts believe there is still room to run over the next month.
In the world of earnings reports, retailers were in focus today. Target (TGT) and Lowe’s (LOW) both reported earnings that topped Wall Street estimates. Shares of both companies gained more than 5%. Staples (SPLS) also reported higher earnings today, and the stock surged 9%.
In Asian markets, Tokyo’s Nikkei 225 index dropped 0.3% and Hong Kong’s Hang Seng index fell 0.7%. European stocks were mixed as Britain’s FTSE index fell 0.2% and Germany’s DAX index gained 0.2%.
2 of our 10 ETFs in the Spotlight gained on the day while making new highs at the same time as the YTD table below shows.
2. ETFs in the Spotlight
In case you missed the announcement and description of this section, you can read it here again.
It features 10 broadly diversified ETFs from my HighVolume list as posted every Monday. Furthermore, they are screened for the lowest MaxDD% number meaning they have been showing better resistance to temporary sell offs than all others over the past year.
Here are the 10 candidates:
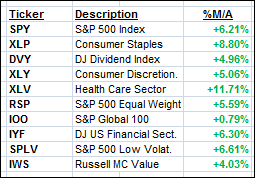
The above table simply demonstrates the magnitude with which some of the ETFs are fluctuating in regards to their positions above or below their respective individual trend lines (%M/A). A break below, represented by a negative number, shows weakness, while a break above, represented by a positive percentage, shows strength.
Year to date, here’s how the above candidates have fared so far:
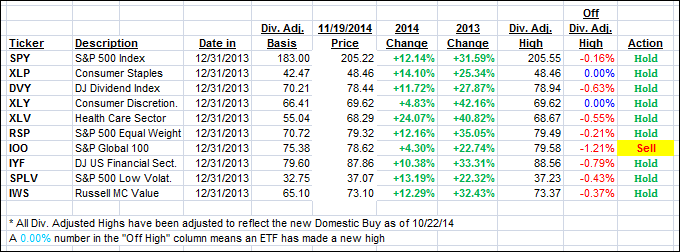
Again, the first table above shows the position of the various ETFs in relation to their respective long term trend lines (%M/A), while the second one tracks their trailing sell stops in the “Off High” column. The “Action” column will signal a “Sell” once the -7.5% point has been taken out in the “Off High” column.
3. Trend Tracking Indexes (TTIs)
Our Trend Tracking Indexes (TTIs) both slipped immaterially as the major indexes bounced aimlessly slightly below the unchanged line.
Here’s how we ended up:
Domestic TTI: +3.10% (last close +3.30%)—Buy signal since 10/22/2014
International TTI: +0.53% (last close +0.57%)—Sell signal since 10/1/2014
Disclosure: I am obliged to inform you that I, as well as advisory clients of mine, own some of these listed ETFs. Furthermore, they do not represent a specific investment recommendation for you, they merely show which ETFs from the universe I track are falling within the guidelines specified.
Contact Ulli