
1. Moving the Markets
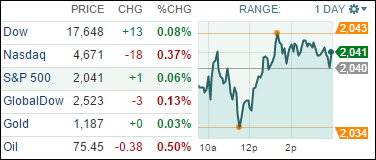
U.S. stocks changed little today. The S&P 500 and Dow both gained a tad, while the Nasdaq slipped 0.37% into negative territory.
M&A news stole a number of headlines today, focusing on two major mergers that entail a combined $100 billion value. The first was Activis PLC’s $66 billion bid for botox maker Allergan. The second was Halliburton’s $35 billion offer for rival oil services company Baker Hughes. Shares of Baker Hughes (BHI) gained 8.92% to close at $65.23 today on the news. However, the news couldn’t lift battered energy stocks, which on average fell 1.1% today.
A separate large portion of headlines today focused on the opening of the China’s A-share markets to foreign investment. The Shanghai-Hong Kong Stock Connect is expected to allow the equivalent of USD $3.8 billion per day in transactions and open up the mainland equity market to the world. In short, the link enables international investors to trade selected stocks on Shanghai’s tightly restricted exchange and let mainland investors buy shares in Hong Kong.
The key questions investors should be asking are not which stocks to buy but how does this new market facilitate greater access to and circulation of the Chinese Renminbi currency?
9 of our 10 ETFs in the Spotlight managed to close up while 3 of them made new highs as the YTD table below shows.
2. ETFs in the Spotlight
In case you missed the announcement and description of this section, you can read it here again.
It features 10 broadly diversified ETFs from my HighVolume list as posted every Monday. Furthermore, they are screened for the lowest MaxDD% number meaning they have been showing better resistance to temporary sell offs than all others over the past year.
Here are the 10 candidates:
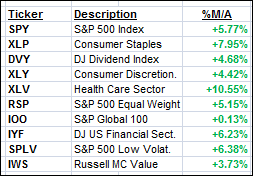
The above table simply demonstrates the magnitude with which some of the ETFs are fluctuating in regards to their positions above or below their respective individual trend lines (%M/A). A break below, represented by a negative number, shows weakness, while a break above, represented by a positive percentage, shows strength.
Year to date, here’s how the above candidates have fared so far:
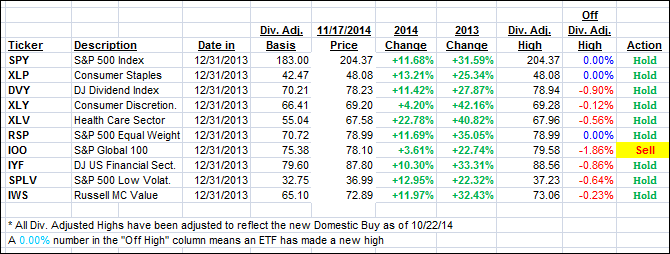
Again, the first table above shows the position of the various ETFs in relation to their respective long term trend lines (%M/A), while the second one tracks their trailing sell stops in the “Off High” column. The “Action” column will signal a “Sell” once the -7.5% point has been taken out in the “Off High” column.
3. Trend Tracking Indexes (TTIs)
Our Trend Tracking Indexes (TTIs) slipped a tad with the International one once again heading below its long-term trend line. Clearly, a new upward trend has not emerged yet in that arena, so we will remain in “Sell” mode for the time being.
Here’s how we ended up:
Domestic TTI: +2.96% (last close +3.13%)—Buy signal since 10/22/2014
International TTI: -0.11% (last close +0.20%)—Sell signal since 10/1/2014
Disclosure: I am obliged to inform you that I, as well as advisory clients of mine, own some of these listed ETFs. Furthermore, they do not represent a specific investment recommendation for you, they merely show which ETFs from the universe I track are falling within the guidelines specified.
Contact Ulli