
1. Moving the Markets
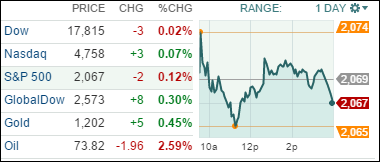
Stocks dipped lower late in the trading day, as investors tried to balance falling consumer confidence against a better-than-expected report on economic growth. The S&P 500 dropped 0.12%, the Dow shed 0.02%, however the Nasdaq gained 0.07%. Crude oil prices also dropped 2.5% today to close at $74.30 a barrel.
Consumer confidence unexpectedly fell in November as the Conference Board’s closely watched index dropped to 88.7 from 94.1 in October. Overall, the economy has notched the best six months of growth since 2003, including a 4.6% annualized rate of expansion in the second quarter, following a first-quarter contraction caused largely by severe winter weather. Monthly job growth has picked up this year, and factory output and business investment have advanced, while consumer spending and the housing market have been mixed.
The major event this week is a meeting in Vienna on Thursday of members of the Organization of Petroleum Exporting Countries. As the price of oil continues to slump, traders will be looking for a possible agreement to cut production to increase demand, i.e. prices. The price of crude has tumbled 26% since June.
3 of our 10 ETFs in the Spotlight edged up during this see-saw day with all 3 of them making new highs while 2 of them remained unchanged, as the YTD table below shows.
2. ETFs in the Spotlight
In case you missed the announcement and description of this section, you can read it here again.
It features 10 broadly diversified ETFs from my HighVolume list as posted every Monday. Furthermore, they are screened for the lowest MaxDD% number meaning they have been showing better resistance to temporary sell offs than all others over the past year.
Here are the 10 candidates:
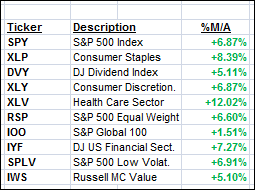
The above table simply demonstrates the magnitude with which some of the ETFs are fluctuating in regards to their positions above or below their respective individual trend lines (%M/A). A break below, represented by a negative number, shows weakness, while a break above, represented by a positive percentage, shows strength.
Year to date, here’s how the above candidates have fared so far:
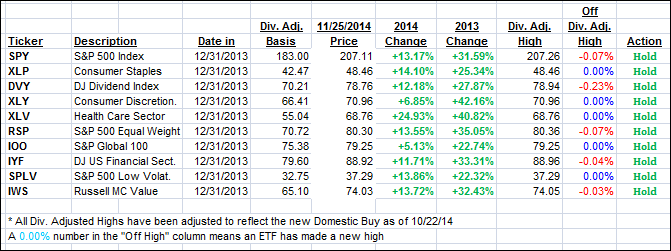
Again, the first table above shows the position of the various ETFs in relation to their respective long term trend lines (%M/A), while the second one tracks their trailing sell stops in the “Off High” column. The “Action” column will signal a “Sell” once the -7.5% point has been taken out in the “Off High” column.
3. Trend Tracking Indexes (TTIs)
Our Trend Tracking Indexes (TTIs) managed to improve slightly despite the major indexes going sideways for the day.
Here’s how we ended up:
Domestic TTI: +3.86% (last close +3.79%)—Buy signal since 10/22/2014
International TTI: +1.82% (last close +1.52%)—New Buy signal effective 11/24/14
Disclosure: I am obliged to inform you that I, as well as advisory clients of mine, own some of these listed ETFs. Furthermore, they do not represent a specific investment recommendation for you, they merely show which ETFs from the universe I track are falling within the guidelines specified.
Contact Ulli