
1. Moving the Markets
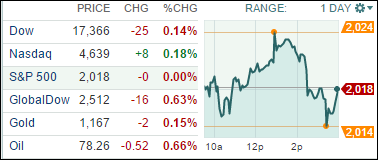
October, the spooky, volatile month best known for stock market crashes, is finally over after giving investors a brief, frightful scare. However, stocks retreated slightly today as oil prices tumbled more than 2% to below $79 a barrel. The S&P 500 dropped 0.01%, the Dow fell 0.1% and the Nasdaq squeezed out a slight gain rising 0.2%.
To me, it seemed investors were taking a “wait and see” approach today as they await a slew of economic news due this week, which includes the latest government report on monthly job gains and the unemployment rate. Also, the mid-term elections, which are just one day away, may be adding to the hesitancy we saw in trading today.
Not all news is bad though, as November typically has a market-friendly reputation and historically has been the beginning of the most bullish six-month period for U.S. stocks.
Investors will likely be targeting the effects of the Fed winding down their quantitative easing program. The general feeling throughout news today is that stock investors will be grappling with the prospect of coming interest rate hikes from the Fed in 2015, and the market is likely to become more volatile as projections of when the first rate hike will come moves either forward or backward due to incoming economic data.
Despite the ups and downs of the day, 8 of our 10 ETFs in the Spotlight managed to close higher.
2. ETFs in the Spotlight
In case you missed the announcement and description of this section, you can read it here again.
It features 10 broadly diversified ETFs from my HighVolume list as posted every Monday. Furthermore, they are screened for the lowest MaxDD% number meaning they have been showing better resistance to temporary sell offs than all others over the past year.
Here are the 10 candidates:
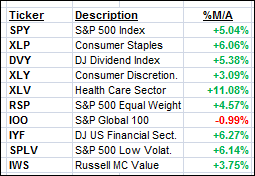
The above table simply demonstrates the magnitude with which some of the ETFs are fluctuating in regards to their positions above or below their respective individual trend lines (%M/A). A break below, represented by a negative number, shows weakness, while a break above, represented by a positive percentage, shows strength.
Year to date, here’s how the above candidates have fared so far:
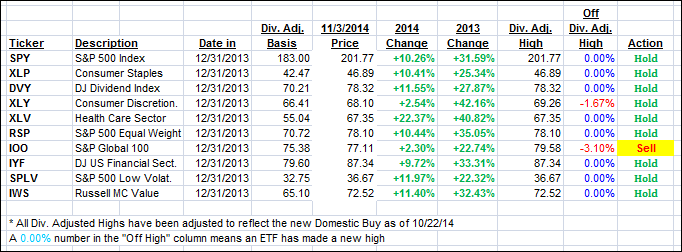
To be clear, the first table above shows the position of the various ETFs in relation to their respective long term trend lines (%M/A), while the second one tracks their trailing sell stops in the “Off High” column. The “Action” column will signal a “Sell” once the -7.5% point has been taken out in the “Off High” column.
3. Trend Tracking Indexes (TTIs)
Our Trend Tracking Indexes (TTIs) both slipped a tad with the International one dipping deeper into bear market territory.
Here’s how we closed:
Domestic TTI: +2.80% (last close +2.93%)—Buy signal since 10/22/2014
International TTI: -0.99% (last Friday -0.39%)—Sell signal since 10/1/2014
Disclosure: I am obliged to inform you that I, as well as advisory clients of mine, own some of these listed ETFs. Furthermore, they do not represent a specific investment recommendation for you, they merely show which ETFs from the universe I track are falling within the guidelines specified.
Contact Ulli