
1. Moving the Markets
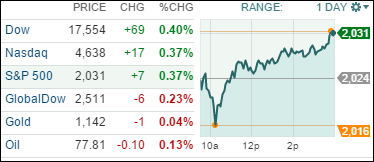
The S&P 500 and the Dow rose to new record highs today, again. At the close, the S&P 500, Dow and Nasdaq were all up 0.4%. One of the major factors moving the markets higher today was that the ECB announced it is leaving interest rates unchanged and will continue to boost economic stimulus.
Europe benchmarks took huge, initial leaps of 3% or so on news of region-wide stimulus, but the gains eased considerably as the trading day wore on. The DAX of Germany ended 0.7% higher, the CAC 40 of France finished up 0.5% and Britain’s FTSE closed up 0.2%.
In local economic news, we received word today that U.S. workers’ productivity increased more rapidly than expected during Q3 as a solid jump in output offset a rise in hours worked. Labor productivity, or output per hours worked, rose at a 2% annual rate. Economists had expected a 1.1% increase.
It is only fitting to touch on precious metals, given the positive numbers we have seen on domestic growth of late. Gold and silver have been taking a beating in recent weeks. Gold spent much of 2014 trading around $1,250 an ounce. Now it trades below $1,145, which is its lowest level in over four years. Remember that Investors buy gold when they’re scared. Right now the U.S. economy continues to chug along, Ebola fears have faded, tensions with Russia have eased and Western countries believe they are containing ISIS.
8 of our 10 ETFs in the Spotlight gained today with 6 of them making new highs for the year.
2. ETFs in the Spotlight
In case you missed the announcement and description of this section, you can read it here again.
It features 10 broadly diversified ETFs from my HighVolume list as posted every Monday. Furthermore, they are screened for the lowest MaxDD% number meaning they have been showing better resistance to temporary sell offs than all others over the past year.
Here are the 10 candidates:
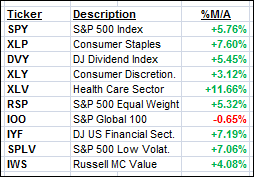
The above table simply demonstrates the magnitude with which some of the ETFs are fluctuating in regards to their positions above or below their respective individual trend lines (%M/A). A break below, represented by a negative number, shows weakness, while a break above, represented by a positive percentage, shows strength.
Year to date, here’s how the above candidates have fared so far:
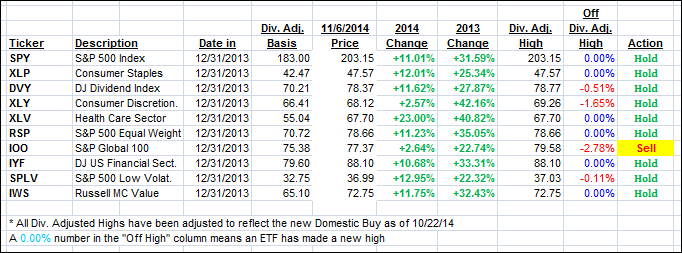
Again, the first table above shows the position of the various ETFs in relation to their respective long term trend lines (%M/A), while the second one tracks their trailing sell stops in the “Off High” column. The “Action” column will signal a “Sell” once the -7.5% point has been taken out in the “Off High” column.
3. Trend Tracking Indexes (TTIs)
Our Trend Tracking Indexes (TTIs) both improved again with International one moving closer to its long-term trend line in an attempt to pierce through to the bullish side.
Here’s how we closed:
Domestic TTI: +3.05% (last close +2.85%)—Buy signal since 10/22/2014
International TTI: -0.52% (last close -0.63%)—Sell signal since 10/1/2014
Disclosure: I am obliged to inform you that I, as well as advisory clients of mine, own some of these listed ETFs. Furthermore, they do not represent a specific investment recommendation for you, they merely show which ETFs from the universe I track are falling within the guidelines specified.
Contact Ulli