
1. Moving the Markets
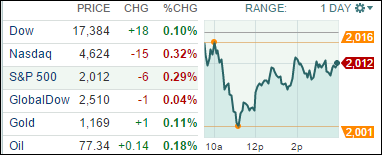
Stocks closed mostly lower today, primarily driven by falling oil prices and renewed fears of a global economic slowdown. The S&P 500 dropped 0.29%, the Nasdaq fell 0.32%, while the Dow gained 0.10%.
Oil prices fell to a three-year low as Saudi Arabia cut prices of crude exported to the U.S.
A barrel of U.S. crude fell as low as $75.84 a barrel Tuesday before rebounding to $77.19, down 2% for the day, still the lowest closing price since October 4, 2011. Crude has come under severe pressure in recent weeks amid fears of reduced demand around the globe due to slowing growth in places like the eurozone and China. As a result, shares of major U.S. oil stocks, such as Exxon-Mobil (XOM), Chevron (CVX) and ConocoPhillips (COP) suffered losses today.
In other economic news, we heard today that the U.S. trade deficit rose in September to its highest level since May as exports fell. The Commerce Department said the trade deficit widened to $43.0 billion in September, up from a revised $40.0 billion in August.
Here’s a bit of info that might brighten your day though. November is the second-best performing month for the past 20 years. It also starts the best six-month “bull” period going back to 1950. And finally, after the stock market’s stunning rebound the past two weeks, November started with both the Dow and S&P 500 indexes back at record highs.
2. ETFs in the Spotlight
In case you missed the announcement and description of this section, you can read it here again.
It features 10 broadly diversified ETFs from my HighVolume list as posted every Monday. Furthermore, they are screened for the lowest MaxDD% number meaning they have been showing better resistance to temporary sell offs than all others over the past year.
Here are the 10 candidates:
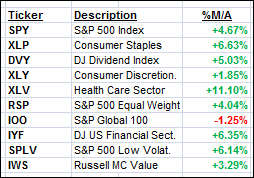
The above table simply demonstrates the magnitude with which some of the ETFs are fluctuating in regards to their positions above or below their respective individual trend lines (%M/A). A break below, represented by a negative number, shows weakness, while a break above, represented by a positive percentage, shows strength.
Year to date, here’s how the above candidates have fared so far:
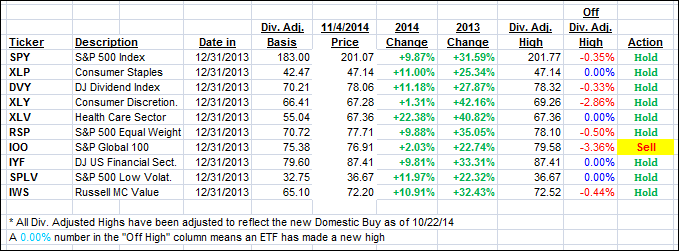
To be clear, the first table above shows the position of the various ETFs in relation to their respective long term trend lines (%M/A), while the second one tracks their trailing sell stops in the “Off High” column. The “Action” column will signal a “Sell” once the -7.5% point has been taken out in the “Off High” column.
3. Trend Tracking Indexes (TTIs)
Our Trend Tracking Indexes (TTIs) both slipped again as the major indexes remained directionless on the day.
Here’s how we closed:
Domestic TTI: +2.61% (last close +2.80%)—Buy signal since 10/22/2014
International TTI: -1.02% (last close -0.99%)—Sell signal since 10/1/2014
Disclosure: I am obliged to inform you that I, as well as advisory clients of mine, own some of these listed ETFs. Furthermore, they do not represent a specific investment recommendation for you, they merely show which ETFs from the universe I track are falling within the guidelines specified.
Contact Ulli