
1. Moving the Markets
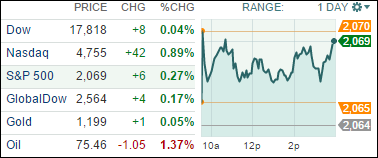
Stocks continued their climb upwards heading towards the Holiday season today. The S&P 500 gained 0.27%, the Dow was up 0.04% and the Nasdaq added 0.89%. The Dow and S&P both set new record highs today, which was the 29th time this year for the Dow and the 46th time for the S&P. Wall Street is hoping that the markets extend their 5-week winning streak in this shortened Holiday week.
We have been talking about Apple (AAPL) off and on over the past week, as investors have been speculating as to whether or not they will become the first ever $700 billion company. Well, shares of apple gained 1.85% today to close at 118.63, which pushed the market cap higher to $695.72 billion. How high can they go?
Interestingly enough, the timber market stole a couple of headlines today, but it seems that now timber is an investment more suitable for the wealthiest 1%. After seeing their portfolios pummeled during the recession, many wealthy people (according to Bloomberg) have flocked to asset classes that don’t rise and fall with the stock markets. Timber is a long-term play, and most investors see it as a tool to transfer wealth from one generation to another…or to simply cover everyday expenses by granting hunting licenses and selling off pine straw, which is commonly used in landscaping.
8 of our 10 ETFs in the Spotlight inched up today with 7 of them making new highs as the YTD table below shows.
2. ETFs in the Spotlight
In case you missed the announcement and description of this section, you can read it here again.
It features 10 broadly diversified ETFs from my HighVolume list as posted every Monday. Furthermore, they are screened for the lowest MaxDD% number meaning they have been showing better resistance to temporary sell offs than all others over the past year.
Here are the 10 candidates:
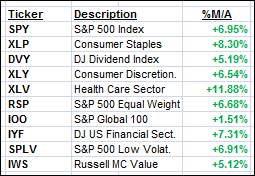
The above table simply demonstrates the magnitude with which some of the ETFs are fluctuating in regards to their positions above or below their respective individual trend lines (%M/A). A break below, represented by a negative number, shows weakness, while a break above, represented by a positive percentage, shows strength.
Year to date, here’s how the above candidates have fared so far:
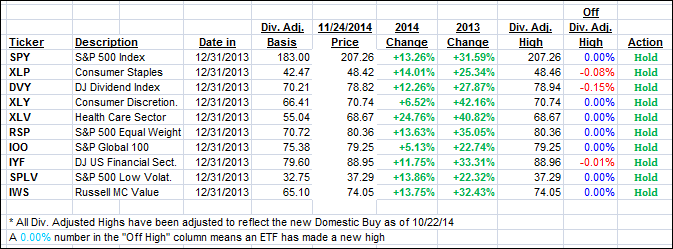
Again, the first table above shows the position of the various ETFs in relation to their respective long term trend lines (%M/A), while the second one tracks their trailing sell stops in the “Off High” column. The “Action” column will signal a “Sell” once the -7.5% point has been taken out in the “Off High” column.
3. Trend Tracking Indexes (TTIs)
Our Trend Tracking Indexes (TTIs) followed the continued upward momentum and closed higher.
Here’s how we ended up:
Domestic TTI: +3.79% (last close +3.47%)—Buy signal since 10/22/2014
International TTI: +1.52% (last close +1.24%)—New Buy signal effective 11/24/14
Disclosure: I am obliged to inform you that I, as well as advisory clients of mine, own some of these listed ETFs. Furthermore, they do not represent a specific investment recommendation for you, they merely show which ETFs from the universe I track are falling within the guidelines specified.
Contact Ulli