
1. Moving the Markets
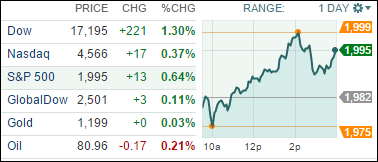
All the major indexes closed higher today as stocks jumped up across the board on fresh signs the economy is growing stronger, signaled by a positive GDP report. The Dow added 1.3%, the S&P 500 rose 0.6% and the Nasdaq finished up 0.4%. Investors are still a little uneasy though as to how the economy will fare, now that the Fed has officially ended its quantitative easing program
Visa had a big impact on the Dow’s upward movement today as shares surged more than 10.2% following its earnings report that topped analyst expectations.
In tech, it seems the latest trend is earnings reports that disappoint or slowed growth forecast. We have already seen Facebook (FB) and Twitter (TWTR) post sub-par earnings reports. Today, LinkedIn (LNKD) posted earnings that beat expectations, however their updated fourth-quarter revenue forecast showed slowing growth and the stock fell 5%.
And finally, in auto news, both Chrysler (FCAU) and Ford (F) are in the dog house as they have to initiate massive recalls: 503,000 recalls for Chrysler and 205,000 for Ford. Careful on the road everyone!
2. ETFs in the Spotlight
In case you missed the announcement and description of this section, you can read it here again.
It features 10 broadly diversified ETFs from my HighVolume list as posted every Monday. Furthermore, they are screened for the lowest MaxDD% number meaning they have been showing better resistance to temporary sell offs than all others over the past year.
Here are the 10 candidates:
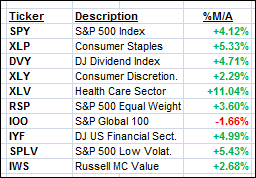
The above table simply demonstrates the magnitude with which some of the ETFs are fluctuating in regards to their positions above or below their respective individual trend lines (%M/A). A break below, represented by a negative number, shows weakness, while a break above, represented by a positive percentage, shows strength.
Year to date, here’s how the above candidates have fared so far:
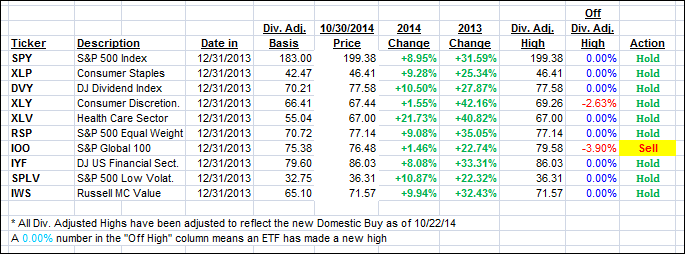
To be clear, the first table above shows the position of the various ETFs in relation to their respective long term trend lines (%M/A), while the second one tracks their trailing sell stops in the “Off High” column. The “Action” column will signal a “Sell” once the -7.5% point has been taken out in the “Off High” column.
3. Trend Tracking Indexes (TTIs)
Our Trend Tracking Indexes (TTIs) improved from yesterday’s close and ended up as follows:
Domestic TTI: +2.49% (last close +2.00%)—Buy signal since 10/22/2014
International TTI: -1.28% (last close -1.81%)—Sell signal since 10/1/2014
Disclosure: I am obliged to inform you that I, as well as advisory clients of mine, own some of these listed ETFs. Furthermore, they do not represent a specific investment recommendation for you, they merely show which ETFs from the universe I track are falling within the guidelines specified.
Contact Ulli