1. Moving the Markets
The markets took a nosedive and were covered in red today. All major indexes dropped more than 1.5%, as concern about the European economy and upcoming U.S. corporate earnings reports sent the Dow Jones industrials to its biggest loss in more than three months.
The IMF added to bearish sentiment today as they announced a cut in global growth estimates to 3.3% for 2014, down from 3.4% in July. The IMF cited geopolitical risks in the Middle East and Ukraine as the primary driver.
On the horizon, Wall Street is bracing for the unofficial start of the Q3 earnings season, which kicks off after Wednesday’s closing bell when aluminum maker Alcoa (AA) will report. Investors are also awaiting tomorrow’s release of the minutes of the Federal Reserve’s September policy meeting. The common theme of higher interest rates in the future still looms. How soon though is the big unknown question.
It’s no surprise that all of our 10 ETFs in the Spotlight headed south with 4 of them crossing their individual trend lines into bear market territory. Please see the tables below for more details.
2. ETFs in the Spotlight
In case you missed the announcement and description of this section, you can read it here again.
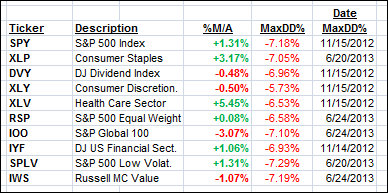
It features 10 broadly diversified ETFs from my HighVolume list as posted every Monday. Furthermore, they are screened for the lowest MaxDD% number meaning they have been showing better resistance to temporary sell offs than all others over the past year.
Here are the 10 candidates:
All of them, except IOO, DVY, XLY, IWS are currently in “buy” mode, meaning their prices are above their respective long term trend lines by the percentage indicated (%M/A).
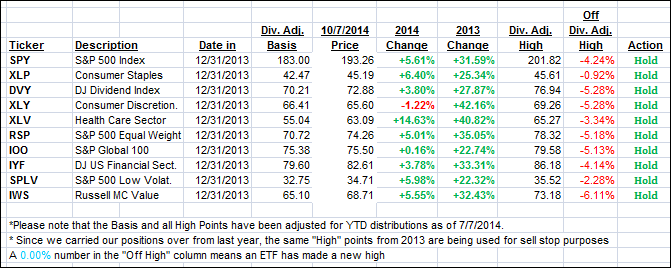
Year to date, here’s how the above candidates have fared so far:
To be clear, the first table above shows the position of the various ETFs in relation to their respective long term trend lines (%M/A), while the second one tracks their trailing sell stops in the “Off High” column. The “Action” column will signal a “Sell” once the -7.5% point is taken out in the “Off High” column.
3. Domestic Trend Tracking Indexes (TTIs)
Our Trend Tracking Indexes (TTIs) headed south with the Domestic one remaing on the bullish side—but only barely. The International TTI sank deeper into bearish territory confirming our Sell signal for that arena as of 10/1/14:
Domestic TTI: +0.39% (last close +1.10%)
International TTI: -2.79% (last close -1.74%)
Disclosure: I am obliged to inform you that I, as well as advisory clients of mine, own some of these listed ETFs. Furthermore, they do not represent a specific investment recommendation for you, they merely show which ETFs from the universe I track are falling within the guidelines specified.
Contact Ulli


