
1. Moving the Markets
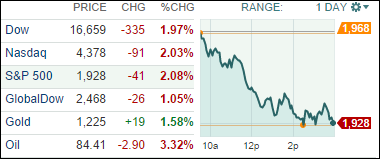
Equities took quite a beating today upon renewed worries about global economic growth, corporate earnings and market valuations. The S&P 500 fell 2.08%, the Dow dropped 1.97% and the Nasdaq lost 2.03%. Ouch!
Markets have been extremely volatile so far this month. We have seen five days in October where major indexes have moved more than 1%, which is more days than the past five months combined! Remember though that October is, historically speaking, the most volatile month of the year.
It seems economic issues remain a concern both here at home and abroad. Government officials in Europe are arguing over the best way to ward off an impending recession, growth is slowing to a relative crawl in China and Japan is tipping into a recession.
For their part the Federal Reserve acknowledged these global concerns yesterday and suggested they would be very cautious about raising interest rates because of such worries. With third quarter earnings season now underway, corporate profits could be key to moving the market in a solid direction.
All of our 10 ETFs in the Spotlight did an about face and joined the reversal, which made yesterday’s strong rebound look like a dead cat bounce. See the effect on our TTIs in section 3 below.
2. ETFs in the Spotlight
In case you missed the announcement and description of this section, you can read it here again.
It features 10 broadly diversified ETFs from my HighVolume list as posted every Monday. Furthermore, they are screened for the lowest MaxDD% number meaning they have been showing better resistance to temporary sell offs than all others over the past year.
Here are the 10 candidates:
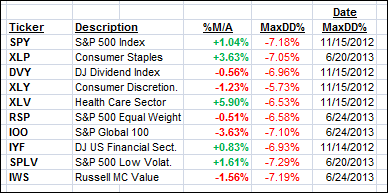
All of them, except IOO, DVY, XLY, RSP, IWS, are currently in “buy” mode, meaning their prices are above their respective long term trend lines by the percentage indicated (%M/A).
Year to date, here’s how the above candidates have fared so far:
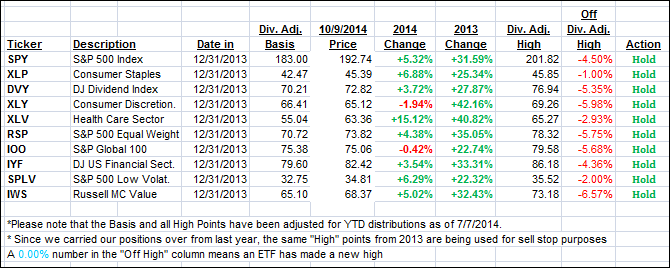
To be clear, the first table above shows the position of the various ETFs in relation to their respective long term trend lines (%M/A), while the second one tracks their trailing sell stops in the “Off High” column. The “Action” column will signal a “Sell” once the -7.5% point is taken out in the “Off High” column.
3. Domestic Trend Tracking Indexes (TTIs)
Our Trend Tracking Indexes (TTIs) headed south with the International one sinking deeper into bear market territory since our Sell signal effective 10/1/14, while the Domestic one is heading closer to crossing its long-term trend line to the downside. Stay tuned, as we may be in for more downside surprises.
Here are the numbers for this volatile day:
Domestic TTI: +0.27% (last close +1.37%)
International TTI: -3.68% (last close -1.99%)
Disclosure: I am obliged to inform you that I, as well as advisory clients of mine, own some of these listed ETFs. Furthermore, they do not represent a specific investment recommendation for you, they merely show which ETFs from the universe I track are falling within the guidelines specified.
Contact Ulli