
1. Moving the Markets
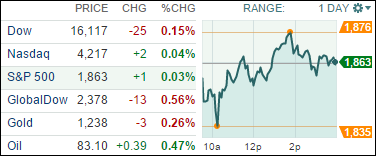
The S&P 500 and Nasdaq both ended a shade above 0.01% while the Dow dropped 0.15%. This was the sixth straight day that the Dow declined.
Both Apple (AAPL) and Google (GOOG) headed south as well. Investors were hoping that Apple’s unveiling of the new iPad would excite investors; however, iPad sales have stagnated recently as consumers tend to keep their tablets longer than other products like smartphones. Google announced its Q3 earnings today, which was just shy of analyst estimates. Most troubling to investors perhaps was that Google posted a slowdown in the total number of ads, or paid clicks, in the three months that ended Sept. 30.
It seems that the general mood of the market remains pessimistic, despite a fresh plate of good economic news including a Labor Department report that initial jobless claims had fallen to a seasonally adjusted 264,000 last week – lowest in 14 years. Separately, the Federal Reserve said September industrial output rose 1%, the largest jump since May 2010, offsetting fears that the U.S. economy was being crimped by slowing growth abroad.
While there are plenty of forecasts as to where the indexes will go, some technicians predict an S&P 500 drop to the 1,770 area if the 1,900 level does not get conquered by a week from Friday. We will watch safely from the sidelines to see if there is more downside to come.
6 of our 10 ETFs in the Spotlight managed to close slightly higher, however, we remain on the sidelines with our TTIs being stuck in bearish territory. Please see section 3 for more details.
2. ETFs in the Spotlight
In case you missed the announcement and description of this section, you can read it here again.
It features 10 broadly diversified ETFs from my HighVolume list as posted every Monday. Furthermore, they are screened for the lowest MaxDD% number meaning they have been showing better resistance to temporary sell offs than all others over the past year.
Here are the 10 candidates:
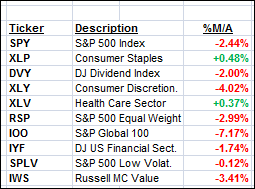
While our Trend Tracking Indexes (TTIs) are in “Sell” mode, I am featuring this table to simply demonstrate the magnitude with which some of the ETFs are fluctuating in regards to their positions above or below their respective individual trend lines (%M/A).
Year to date, here’s how the above candidates have fared so far:
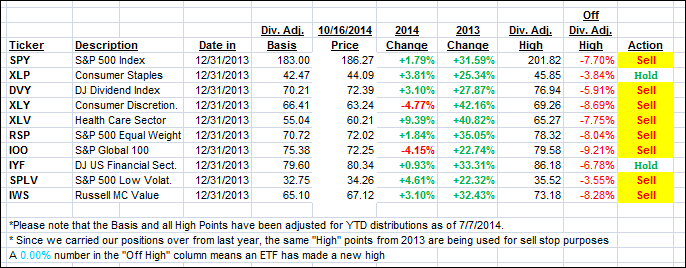
To be clear, the first table above shows the position of the various ETFs in relation to their respective long term trend lines (%M/A), while the second one tracks their trailing sell stops in the “Off High” column.
The “Action” column has been modified to show the effects of our Sell signals. The current “Hold” positions reflect only sector ETFs, which should be sold based on their respective sell stop points.
3. Domestic Trend Tracking Indexes (TTIs)
Our Trend Tracking Indexes (TTIs) changed only slightly during today’s rebound attempt.
Here’s how we ended up:
Domestic TTI: -0.65% (last close -0.74%)—Sell signal effective 10/14/2014
International TTI: -5.73% (last close -5.78%)—Sell signal effective 10/1/2014
Disclosure: I am obliged to inform you that I, as well as advisory clients of mine, own some of these listed ETFs. Furthermore, they do not represent a specific investment recommendation for you, they merely show which ETFs from the universe I track are falling within the guidelines specified.
Contact Ulli