
1. Moving the Markets
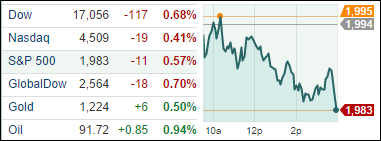
Stocks continued falling today after weaker than expected Eurozone data send European markets downward in addition to news that the U.S. commenced airstrikes against ISIL in Syria. All major indexes fell.
Today, we received news that Bed Bath & Beyond’s (BBBY) second quarter profit numbers exceeded Wall Street expectations. The company reported Q2 profits of $224 million, however, the stock still fell 1.57% today, continuing on its downward slide since January.
Also today, we heard that the latest home price index report from the FHFA showed home prices rose 0.1% in July, less than the 0.5% that was expected. Not a piece of good news to add to the turmoil in the markets today.
And in the Far East, Asian markets were mixed as China’s Shanghai composite index jumped 0.9% on better-than-expected Chinese manufacturing data. Japan’s benchmark Nikkei 225 index fell 0.7% and Hong Kong’s Hang Seng index dropped 0.5%.
All of our 10 ETFs in the Spotlight again headed lower as the slide continued.
2. ETFs in the Spotlight
In case you missed the announcement and description of this section, you can read it here again.
It features 10 broadly diversified ETFs from my HighVolume list as posted every Monday. Furthermore, they are screened for the lowest MaxDD% number meaning they have been showing better resistance to temporary sell offs than all others over the past year.
Here are the 10 candidates:
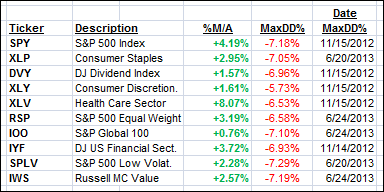
All of them are currently in “buy” mode, meaning their prices are above their respective long term trend lines by the percentage indicated (%M/A).
Year to date, here’s how the above candidates have fared so far:
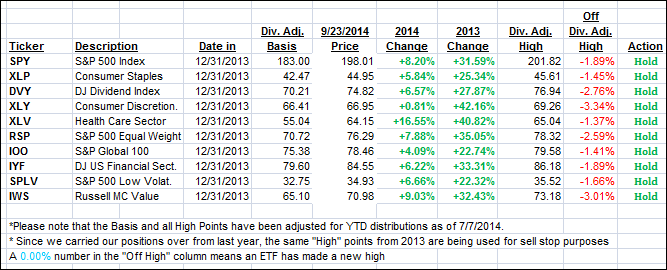
To be clear, the first table above shows the position of the various ETFs in relation to their respective long term trend lines (%M/A), while the second one tracks their trailing sell stops in the “Off High” column. The “Action” column will signal a “Sell” once the -7.5% point is taken out in the “Off High” column.
3. Domestic Trend Tracking Indexes (TTIs)
Our Trend Tracking Indexes (TTIs) headed south with the International one again taking the big hit, as it slid further towards bear market territory:
Domestic TTI: +1.65% (last close +1.93%)
International TTI: +0.23% (last close +0.89%)
Disclosure: I am obliged to inform you that I, as well as advisory clients of mine, own some of these listed ETFs. Furthermore, they do not represent a specific investment recommendation for you, they merely show which ETFs from the universe I track are falling within the guidelines specified.
Contact Ulli