
1. Moving the Markets
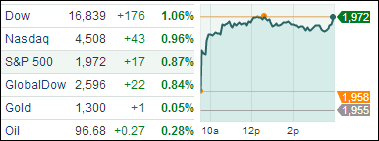
Markets were back in full swing, as the Dow surged 175 points and the Nasdaq hit a 14-year high. The S&P 500 gained 0.9%, the Dow climbed 1.1% and the Nasdaq gained 1%, which marked a fourth straight session of gains.
The buzz around the networks attributed bullish sentiment today on the easing of geopolitical fears abroad, the lack of anticipated surprises from Yellen, and M&A fever.
Talks over the weekend involving Germany, France, the Ukraine and Russia raised hopes of an eventual cease-fire deal, which provided a sigh of relief to investors. Secondly, Wall Street expects that Yellen will opt to keep rates lower for the months to come. Finally, M&A activity is heating up. The big M&A news today was Dollar General (DG) announcing early this morning that they topped Dollar Tree’s (DLTR) bid to acquire Family Dollar (FDO) for $78.50 a share, all in cash!
Airlines were back in the news today, banking off the falling crude oil prices we saw. Crude oil dropped by $1, which stimulated sharp gains in several airlines, including United Continental Holdings (UAL), up 4%, American (AAL) up 3.7%, Southwest (LUV), up 3.5%, Delta (DAL), up 2.5% and JetBlue (JBLU), which gained 3%.
All of our 10 ETFs in the Spotlight showed gains, with one of them making a new high for the year.
2. ETFs in the Spotlight
In case you missed the announcement and description of this section, you can read it here again.
It features 10 broadly diversified ETFs from my HighVolume list as posted every Monday. Furthermore, they are screened for the lowest MaxDD% number meaning they have been showing better resistance to temporary sell offs than all others over the past year.
Here are the 10 candidates:
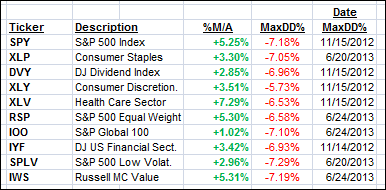
All of them are currently in “buy” mode, meaning their prices are above their respective long term trend lines by the percentage indicated (%M/A).
Year to date, here’s how the above candidates have fared so far:
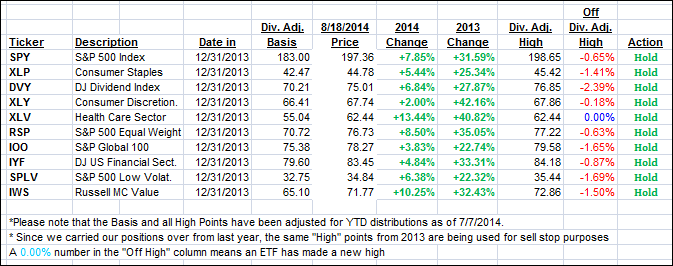
To be clear, the first table above shows the position of the various ETFs in relation to their respective long term trend lines (%M/A), while the second one tracks their trailing sell stops in the “Off High” column. The “Action” column will signal a “Sell” once the -7.5% point is taken out in the “Off High” column.
3. Domestic Trend Tracking Indexes (TTIs)
Our Trend Tracking Indexes (TTIs) joined the renewed optimism and closed higher:
Domestic TTI: +2.76% (last close +2.29%)
International TTI: +1.91% (last close +1.30%)
Disclosure: I am obliged to inform you that I, as well as advisory clients of mine, own some of these listed ETFs. Furthermore, they do not represent a specific investment recommendation for you, they merely show which ETFs from the universe I track are falling within the guidelines specified.
Contact Ulli