
1. Moving the Markets
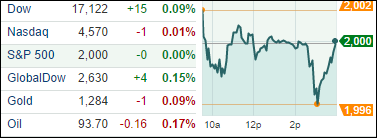
Stocks ended the day relatively unchanged after reeling from the hype of the record setting day it experienced yesterday. The S&P 500 and the Dow both ended flat, while the Nasdaq dropped ever so slightly.
We did see a few retail stocks perform well today after reporting positive earnings news. Tiffany (TIF) reported earnings that topped estimates and shares rose 1%. Express (EXPR) shares gained 13% on the day after the company raised its forecasted profits. And lastly, Michaels (MIK) gained 9% on higher earnings reports.
You may have seen a bit of interesting news from China yesterday. Apparently, real estate prices have been cut as much as 25% within such companies as Greentown China Holdings Ltd., whose stock dropped 33% yesterday. There have been subsequent protests from homeowners accordingly. One Greentown sales manager was quoted as saying that the price-cut was aimed to boost sales and “cope with competition” from rival China Vanke Co. Real estate inflation has always been a serious issue in China and it will be interesting to see how long before the bubble deflates.
6 of our 10 ETFs in the Spotlight inched up while 1 of them made a new high for the year.
2. ETFs in the Spotlight
In case you missed the announcement and description of this section, you can read it here again.
It features 10 broadly diversified ETFs from my HighVolume list as posted every Monday. Furthermore, they are screened for the lowest MaxDD% number meaning they have been showing better resistance to temporary sell offs than all others over the past year.
Here are the 10 candidates:
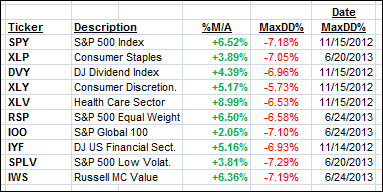
All of them are currently in “buy” mode, meaning their prices are above their respective long term trend lines by the percentage indicated (%M/A).
Year to date, here’s how the above candidates have fared so far:
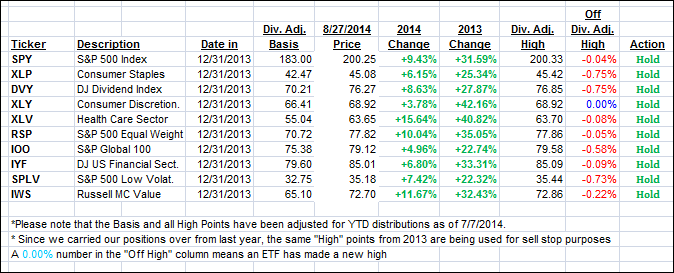
To be clear, the first table above shows the position of the various ETFs in relation to their respective long term trend lines (%M/A), while the second one tracks their trailing sell stops in the “Off High” column. The “Action” column will signal a “Sell” once the -7.5% point is taken out in the “Off High” column.
3. Domestic Trend Tracking Indexes (TTIs)
Our Trend Tracking Indexes (TTIs) eked out a small gain and ended as follows:
Domestic TTI: +3.27% (last close +3.24%)
International TTI: +2.98% (last close +2.85%)
Disclosure: I am obliged to inform you that I, as well as advisory clients of mine, own some of these listed ETFs. Furthermore, they do not represent a specific investment recommendation for you, they merely show which ETFs from the universe I track are falling within the guidelines specified.
Contact Ulli