
1. Moving the Markets
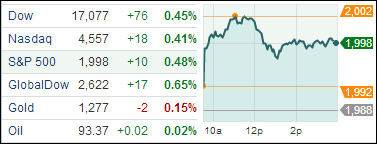
The S&P 500 index broke the 2,000 level for the first time in history today and notched its 29th record close. However, the index dropped later in the day to close at 1998. The other major indexes had notable gains today, with the Dow and Nasdaq both finishing up 0.4%.
The rally today was powered by more deal activity here in the U.S., including a report that fast-food giant Burger King (BKW) is in talks to buy Canadian doughnut chain Tim Hortons (THI). Also, today we heard comments from central bankers in Europe and Japan over the weekend that more market stimulus may be in the pipeline.
Stocks have rallied three straight weeks now as investors continue to be on an improving U.S. economy and a plethora of better-than-expected Q2 earnings announcements. For the recent earnings season, companies in the S&P 500 posted profit growth of 8.4%.
The continued strong data on the economy has enabled investors to generally shrug off geopolitical concerns. The stock market, however, is no longer considered cheap; some argue that the market is trading accordingly with historical norms, while bears warn that stocks are getting pricey.
All of our 10 ETFs in the Spotlight joined the rally with 5 of them making new highs for the year.
2. ETFs in the Spotlight
In case you missed the announcement and description of this section, you can read it here again.
It features 10 broadly diversified ETFs from my HighVolume list as posted every Monday. Furthermore, they are screened for the lowest MaxDD% number meaning they have been showing better resistance to temporary sell offs than all others over the past year.
Here are the 10 candidates:
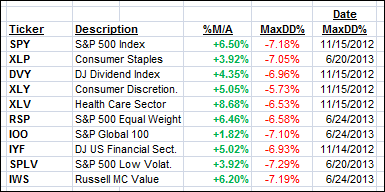
All of them are currently in “buy” mode, meaning their prices are above their respective long term trend lines by the percentage indicated (%M/A).
Year to date, here’s how the above candidates have fared so far:
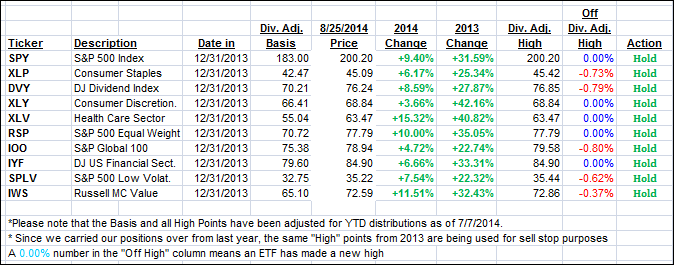
To be clear, the first table above shows the position of the various ETFs in relation to their respective long term trend lines (%M/A), while the second one tracks their trailing sell stops in the “Off High” column. The “Action” column will signal a “Sell” once the -7.5% point is taken out in the “Off High” column.
3. Domestic Trend Tracking Indexes (TTIs)
Our Trend Tracking Indexes (TTIs) headed higher and closed as follows:
Domestic TTI: +3.09% (last close +2.87%)
International TTI: +2.68% (last close +2.15%)
Disclosure: I am obliged to inform you that I, as well as advisory clients of mine, own some of these listed ETFs. Furthermore, they do not represent a specific investment recommendation for you, they merely show which ETFs from the universe I track are falling within the guidelines specified.
Contact Ulli