
1. Moving the Markets
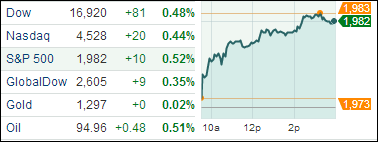
Domestic markets continued to rally today on dissipating geopolitical fears, strong earnings and upbeat housing data. The S&P 500, Dow and Nasdaq all gained as the chart shows.
On the economic front, housing starts surged 15.7% in July and inflation remained minimal. Housing related stocks capitalized on the strong data, and companies such as KB Home, DR Horton and Pulte Group all gained at least 1.5% on the day. What stood out most perhaps was that Home Depot (HD) shares jumped 6% after the update of housing data, as well as their released earnings report which topped analyst expectations.
In tech news, Apple (AAPL) was one of the most heavily traded stocks of the day after the stock reached $100 share for the first time since the 7-for-1 split back in June. Traders also seem to remain bullish on the upcoming release of the iPhone 6.
With tensions between the Ukraine and Russia easing, as well as decreased levels of violence in the Israel conflict, investors remain poised to capitalize on continued economic growth here in the U.S. and appear to be focusing on M&A activity.
Again, all of our 10 ETFs in the Spotlight joined in the continued uptrend, with two of them making new highs for the year as you can see below.
2. ETFs in the Spotlight
In case you missed the announcement and description of this section, you can read it here again.
It features 10 broadly diversified ETFs from my HighVolume list as posted every Monday. Furthermore, they are screened for the lowest MaxDD% number meaning they have been showing better resistance to temporary sell offs than all others over the past year.
Here are the 10 candidates:
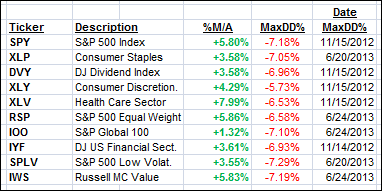
All of them are currently in “buy” mode, meaning their prices are above their respective long term trend lines by the percentage indicated (%M/A).
Year to date, here’s how the above candidates have fared so far:
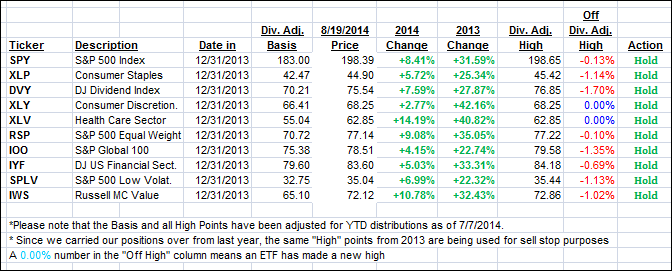
To be clear, the first table above shows the position of the various ETFs in relation to their respective long term trend lines (%M/A), while the second one tracks their trailing sell stops in the “Off High” column. The “Action” column will signal a “Sell” once the -7.5% point is taken out in the “Off High” column.
3. Domestic Trend Tracking Indexes (TTIs)
Our Trend Tracking Indexes (TTIs) continued their rebound and closed as follows:
Domestic TTI: +3.01% (last close +2.76%)
International TTI: +2.25% (last close +1.91%)
Disclosure: I am obliged to inform you that I, as well as advisory clients of mine, own some of these listed ETFs. Furthermore, they do not represent a specific investment recommendation for you, they merely show which ETFs from the universe I track are falling within the guidelines specified.
Contact Ulli