
1. Moving The Markets
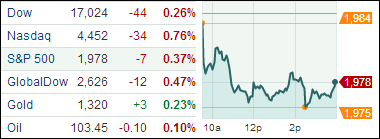
Well, last week ended with a ‘bang’ heading into the 4th of July holiday as the Dow officially passed the 17,000 mark, and the other major indexes both pushed to record highs. The momentum seemed to have fizzled after a long weekend though and the indexes closed Monday lower across the board as the chart above shows.
While there was no one major piece of news that pulled markets lower today, the buzz around the various news studios is that investors secured profits from last week and pulled back a bit today in anticipation of Q2 earnings announcements that will begin funneling in this week. The new earnings season begins Tuesday with results from aluminum producer Alcoa Inc. (AA). We’ll also hear from Wells Fargo & Co. (WFC) on Friday.
Major airlines stocks took a hit today after the TSA announced new security measures that say all electronic devices travelling into the U.S. would need to have power in order to travel, including tablet computers and cell phones, which could impact the number of passengers able to travel. United Continental (UAL) fell 3% to $38.62, Delta (DAL) fell 4.5%, to $36.90 and American Airlines (AAL) fell 4% to $40.10.
Our 10 ETFs in the Spotlight pulled back, and no new highs were made today.
2. ETFs in the Spotlight
In case you missed the announcement and description of this section, you can read it here again.
It features 10 broadly diversified ETFs from my HighVolume list as posted every Monday. Furthermore, they are screened for the lowest MaxDD% number meaning they have been showing better resistance to temporary sell offs than all others over the past year.
In other words, none of them ever triggered their 7.5% sell stop level during this time period, which included a variety of severe market pullbacks but no move into outright bear market territory.
Here are the 10 candidates:
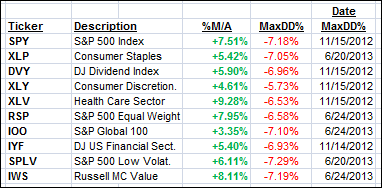
All of them are in “buy” mode, meaning their prices are above their respective long term trend lines by the percentage indicated (%M/A).
Year to date, here’s how the above candidates have fared so far:
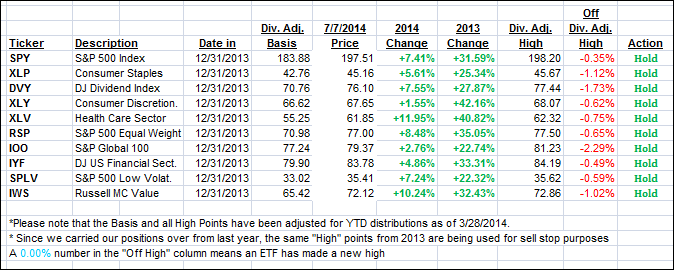
To be clear, the first table above shows the position of the various ETFs in relation to their respective long term trend lines (%M/A), while the second one tracks their trailing sell stops in the “Off High” column. The “Action” column will signal a “Sell” once the -7.5% point is taken out in the “Off High” column.
3. Domestic Trend Tracking Indexes (TTIs)
Our Trend Tracking Indexes (TTIs) gave back some of last week’s gains:
Domestic TTI: +3.90% (last close +4.21%)
International TTI: +4.58% (last close +5.20%)
Disclosure: I am obliged to inform you that I, as well as advisory clients of mine, own some of these listed ETFs. Furthermore, they do not represent a specific investment recommendation for you, they merely show which ETFs from the universe I track are falling within the guidelines specified.
Contact Ulli