
1. Moving the Markets
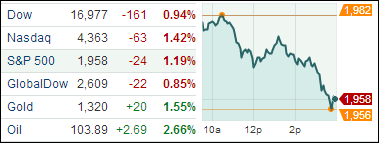
U.S. stocks seemed to have been spooked today by the news of the Malaysian passenger jet that went down in Ukraine near the Russian border. Additional news that Israel had launched a ground offensive into the Gaza Strip only added fuel to the fire, so to speak. The major indexes stumbled, as the chart above shows, with money pouring into U.S. government bonds.
The yield on the 10-year Treasury note fell to its lowest level since May. Gold and oil prices rose. Airlines took a hit, too. The NYSE ARCA Airline index was down 2.7%. Shares of Boeing (BA), whose aircraft was being flown when the Malaysia Airlines plane went down, fell 1.2%.
Despite today’s decline, stocks remain near record territory. The Dow closed at a record high on Wednesday, its second this month, and the S&P 500 is hovering near its most recent all-time high of 1,985.44 set on July 3. These facts may have encouraged investors to sell some of their stock holdings Thursday midst the chaos.
Even with growing geopolitical uncertainty, the market has remained focused on company earnings, which have been mostly favorable so far. Let’s stay tuned for (hopefully) more positive corporate earnings to come.
Our 10 ETFs in the Spotlight stumbled with the indexes; no new highs were made.
2. ETFs in the Spotlight
In case you missed the announcement and description of this section, you can read it here again.
It features 10 broadly diversified ETFs from my HighVolume list as posted every Monday. Furthermore, they are screened for the lowest MaxDD% number meaning they have been showing better resistance to temporary sell offs than all others over the past year.
Here are the 10 candidates:
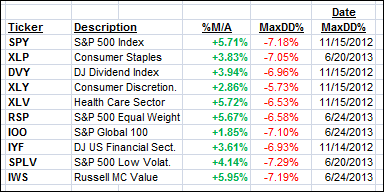
All of them are in “buy” mode, meaning their prices are above their respective long term trend lines by the percentage indicated (%M/A).
Year to date, here’s how the above candidates have fared so far:
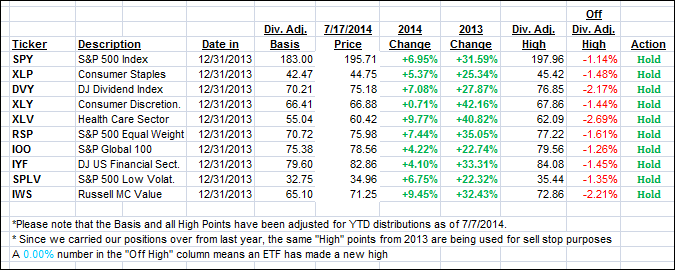
To be clear, the first table above shows the position of the various ETFs in relation to their respective long term trend lines (%M/A), while the second one tracks their trailing sell stops in the “Off High” column. The “Action” column will signal a “Sell” once the -7.5% point is taken out in the “Off High” column.
3. Domestic Trend Tracking Indexes (TTIs)
Our Trend Tracking Indexes (TTIs) suffered from today’s sell-off but remain on the bullish side of their respective trend lines by the following percentages:
Domestic TTI: +2.46% (last close +2.99%)
International TTI: +2.96% (last close +3.77%)
Disclosure: I am obliged to inform you that I, as well as advisory clients of mine, own some of these listed ETFs. Furthermore, they do not represent a specific investment recommendation for you, they merely show which ETFs from the universe I track are falling within the guidelines specified.
Contact Ulli