
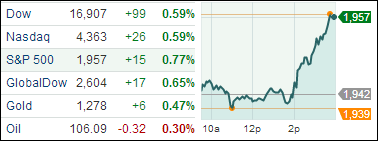
1. Moving The Markets
It was the fourth day in a row that stocks gained across the board and the S&P 500 closed at a new record high. The Dow and Nasdaq both added 0.6% each. While Amazon’s new smartphone was all the rage in the news today, the real market mover was the Federal Reserve, who announced that the U.S. economy was doing well enough for the central bank to make further reductions to its stimulus (bond buying) program.
Now, back to Amazon. The company released their much anticipated “Fire” smartphone today, cementing all the recent speculation as to what would be unveiled today at the expo in Seattle. Investor responses to the phone were positive. Shares of Amazon (AMZN) climbed 2.5% to $333.67 throughout the afternoon.
In international news, Gazprom (GAZP) announced today that it has turned off the taps again to the Ukraine, citing gross overdue payments of roughly $4.5bil have not been received from Kiev. This will obviously only make matters more complicated in Europe amidst massive interest rate cuts by the ECB.
Our 10 ETFs in the Spotlight gained with six of them making new highs; all of them are currently on the plus side YTD.
2. ETFs in the Spotlight
In case you missed the announcement and description of this section, you can read it here again.
It features 10 broadly diversified ETFs from my HighVolume list as posted every Monday. Furthermore, they are screened for the lowest MaxDD% number meaning they have been showing better resistance to temporary sell offs than all others over the past year.
In other words, none of them ever triggered their 7.5% sell stop level during this time period, which included a variety of severe market pullbacks but no move into outright bear market territory.
Here are the 10 candidates:
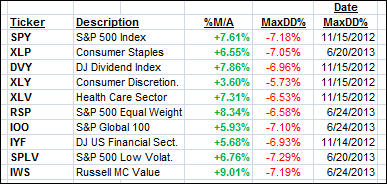
All of them are in “buy” mode, meaning their prices are above their respective long term trend lines by the percentage indicated (%M/A).
Year to date, here’s how the above candidates have fared so far:
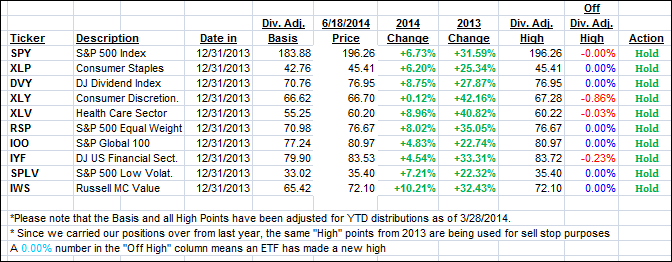
To be clear, the first table above shows the position of the various ETFs in relation to their respective long term trend lines (%M/A), while the second one tracks their trailing sell stops in the “Off High” column. The “Action” column will signal a “Sell” once the -7.5% point is taken out in the “Off High” column.
3. Domestic Trend Tracking Indexes (TTIs)
Our Trend Tracking Indexes (TTIs) picked up steam and ended the day as follows:
Domestic TTI: +3.73% (last close +3.28%)
International TTI: +4.70% (last close +4.03%)
Disclosure: I am obliged to inform you that I, as well as advisory clients of mine, own some of these listed ETFs. Furthermore, they do not represent a specific investment recommendation for you, they merely show which ETFs from the universe I track are falling within the guidelines specified.
Contact Ulli