
1. Moving The Markets
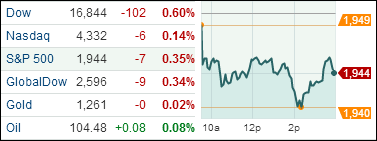
The U.S. markets slid back into negative territory today as a response to the World Bank announcing its reduction of the global growth forecast from 3.2 to 2.8%. The selloff was broad, as every S&P 500 sector index (except energy) declined for the day. The World Bank has clarified that the looming interest rates in United States and United Kingdom have a large impact on the forecast. While the economy has been slowly recovering from a topsy-turvy Q1, the World Bank suggests that the impact of Q1 would hurt the global economy throughout the year.
One of the biggest losers today was Bank of America (BAC), which dropped 2.1%. Apparently, the bank has hit a wall in their negotiations with the govt regarding the ongoing multi-million dollar settlement that stems back to the mortgage crisis of 2008.
News of the airline industry zoomed across headlines today. Lufthansa cut their 2014 forecast due to a slowdown in consumer demand; United Continental, Delta and American Airlines all witnessed a drop in share price today. It may surprise you to hear that Delta’s stock is actually up 48% this year, which is the highest of any airline stock.
Our 10 ETFs in the Spotlight slipped with XLY now showing a negative result again YTD.
2. ETFs in the Spotlight
In case you missed the announcement and description of this section, you can read it here again.
It features 10 broadly diversified ETFs from my HighVolume list as posted every Monday. Furthermore, they are screened for the lowest MaxDD% number meaning they have been showing better resistance to temporary sell offs than all others over the past year.
In other words, none of them ever triggered their 7.5% sell stop level during this time period, which included a variety of severe market pullbacks but no move into outright bear market territory.
Here are the 10 candidates:
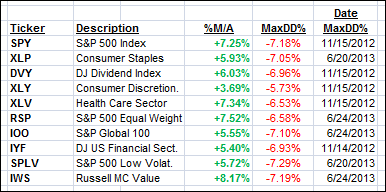
All of them are in “buy” mode, meaning their prices are above their respective long term trend lines by the percentage indicated (%M/A).
Year to date, here’s how the above candidates have fared so far:
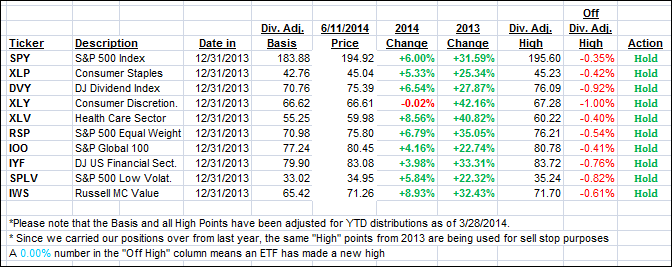
To be clear, the first table above shows the position of the various ETFs in relation to their respective long term trend lines (%M/A), while the second one tracks their trailing sell stops in the “Off High” column. The “Action” column will signal a “Sell” once the -7.5% point is taken out in the “Off High” column.
3. Domestic Trend Tracking Indexes (TTIs)
Our Trend Tracking Indexes (TTIs) retreated at tad and reached the following positions in regards to their trend lines:
Domestic TTI: +3.57% (last close +3.65%)
International TTI: +4.80% (last close +4.92%)
Disclosure: I am obliged to inform you that I, as well as advisory clients of mine, own some of these listed ETFs. Furthermore, they do not represent a specific investment recommendation for you, they merely show which ETFs from the universe I track are falling within the guidelines specified.
Contact Ulli