
1. Moving The Markets
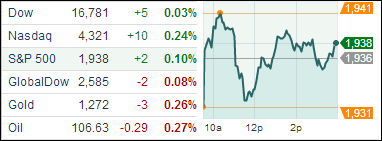
Stocks mostly hovered between small gains and losses through much of the day as traders monitored the conflict in Iraq and considered its potential impact on oil prices. The S&P 500 gained 0.10%, the Dow added 0.03% and the Nasdaq posted a 0.24% gain. The markets have shown a lack of volatility recently, especially compared to the chaotic Q1 we experienced earlier this year. According to the WSJ, Monday was the 41st day in a row that the S&P 500 did not move more than 1% in either direction.
On the M&A front, medical device heavyweight Medtronic Inc (MDT) agreed to buy Dublin-based Covidien Plc (COV) for $42.9 billion and shift its executive headquarters to Ireland. The deal is seen mostly as a way for Medtronic to take advantage of lower tax rates abroad. Also, I heard today that Fusion-io Inc’s (FIO) shares jumped up 22.4% to $11.36 after SanDisk Corp (SNDK) said it will buy the company for about $1.1 billion to boost its flash storage drive business. SanDisk’s shares also gained a hearty 3.6% to $102.00.
Equities also got a boost today from the announcement by the Federal Reserve that factory production increased 0.6% last month with output improving across numerous industries. Manufacturing output in May was led by a 1.5% jump in motor vehicle production. There were also gains in the output of machinery, computer and electronic products, electrical equipment and appliances, and fabricated metal products. Production of primary metals, however, slipped. Finally, the Fed is expected to announce a further cut to its monthly bond purchasing program, but is not seen raising interest rates until mid-2015.
Our 10 ETFs in the Spotlight went sideways with 9 of them remaining on the plus side YTD.
2. ETFs in the Spotlight
In case you missed the announcement and description of this section, you can read it here again.
It features 10 broadly diversified ETFs from my HighVolume list as posted every Monday. Furthermore, they are screened for the lowest MaxDD% number meaning they have been showing better resistance to temporary sell offs than all others over the past year.
In other words, none of them ever triggered their 7.5% sell stop level during this time period, which included a variety of severe market pullbacks but no move into outright bear market territory.
Here are the 10 candidates:
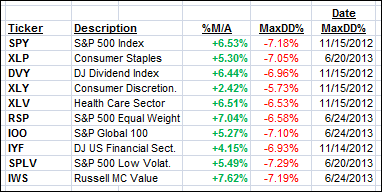
All of them are in “buy” mode, meaning their prices are above their respective long term trend lines by the percentage indicated (%M/A).
Year to date, here’s how the above candidates have fared so far:
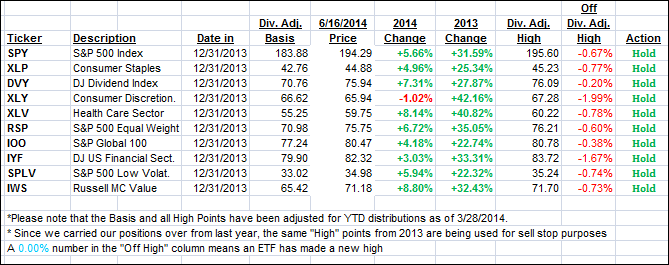
To be clear, the first table above shows the position of the various ETFs in relation to their respective long term trend lines (%M/A), while the second one tracks their trailing sell stops in the “Off High” column. The “Action” column will signal a “Sell” once the -7.5% point is taken out in the “Off High” column.
3. Domestic Trend Tracking Indexes (TTIs)
Our Trend Tracking Indexes (TTIs) slipped as the major indexes essentially went nowhere:
Domestic TTI: +3.21% (last close +3.36%)
International TTI: +4.03% (last close +4.52%)
Disclosure: I am obliged to inform you that I, as well as advisory clients of mine, own some of these listed ETFs. Furthermore, they do not represent a specific investment recommendation for you, they merely show which ETFs from the universe I track are falling within the guidelines specified.
Contact Ulli