
1. Moving The Markets
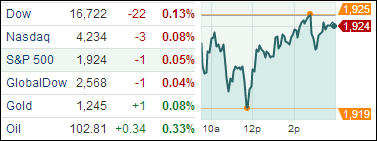
Stocks pulled back a tad, snapping a record breaking streak since last Friday. All major indexes gave back some of their recent gains. Although we saw a drop today, markets have been trending up over the past two weeks.
M&A activity regained their share of headlines, especially the recent Hillshire-Jimmy Dean-Tyson Foods-Pilgrim’s Pride bidding war. Today, Pilgrim’s Pride upped their bid for Hillshire by topping Tyson’s bid of $50/share by $10 to $60/share. Hillshire’s stock reacted positively gaining 9.5% to $58.65, while Pilgrim’s shares fell 2.2% to $25.34.
Well, I was bashing gold yesterday and, of course, as irony would have it the precious metal rose for the first time in six days today. Gold is a common safe haven that often moves in the opposite direction of general stock market trends and that was the case today it seemed as markets dropped. One good day doesn’t cover up the long term trend, which analysts still predict to be an uphill battle, especially given the uncertainties of Thursday’s ECB policy meeting and a big decline in interest rates in the futures market.
Our 10 ETFs in the Spotlight stayed pretty much even; however, 1 of them made a new high today while 9 of them remain on the plus side YTD.
2. ETFs in the Spotlight
In case you missed the announcement and description of this section, you can read it here again.
It features 10 broadly diversified ETFs from my HighVolume list as posted every Monday. Furthermore, they are screened for the lowest MaxDD% number meaning they have been showing better resistance to temporary sell offs than all others over the past year.
In other words, none of them ever triggered their 7.5% sell stop level during this time period, which included a variety of severe market pullbacks but no move into outright bear market territory.
Here are the 10 candidates:
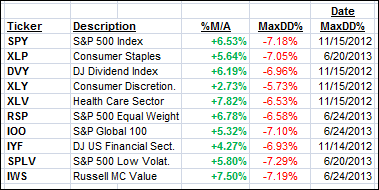
All of them are in “buy” mode, meaning their prices are above their respective long term trend lines by the percentage indicated (%M/A).
Year to date, here’s how the above candidates have fared so far:
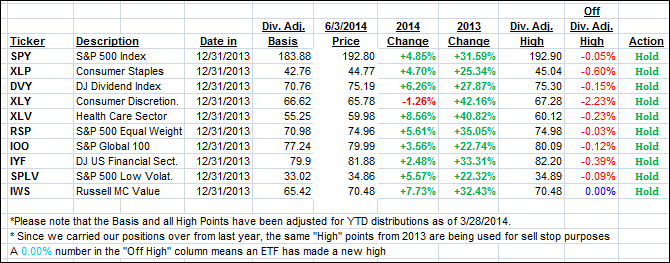
To be clear, the first table above shows the position of the various ETFs in relation to their respective long term trend lines (%M/A), while the second one tracks their trailing sell stops in the “Off High” column. The “Action” column will signal a “Sell” once the -7.5% point is taken out in the “Off High” column.
3. Domestic Trend Tracking Indexes (TTIs)
Our Trend Tracking Indexes (TTIs) went sideways again and changed only insignificantly:
Domestic TTI: +2.93% (last close +3.06%)
International TTI: +4.31% (last close +4.30%)
Disclosure: I am obliged to inform you that I, as well as advisory clients of mine, own some of these listed ETFs. Furthermore, they do not represent a specific investment recommendation for you, they merely show which ETFs from the universe I track are falling within the guidelines specified.
Contact Ulli