
1. Moving The Markets
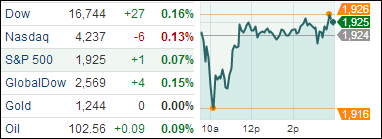
The S&P 500 and Dow both kept moving forward to new record highs today, while the Nasdaq limped to the finish line to close in the red. The S&P 500 realized its 15th record close of 2014, and the Dow posted its 6th record close of the year.
There was a folly in the Manufacturing Index released by the Institute for Supply Management that caused a slight shock in the Dow. The index reported an unexpected drop to 53.2 in May, but actually had improved to 55.4, up from 54.9. The correction shortly thereafter eased sudden concerns about the economy and the Dow climbed back up accordingly.
While the S&P and Dow kept trending upwards, things were not so fruitful for the Nasdaq today. Big names like Amazon (AMZN), Biogen (BIIB), Google (GOOG) and Tesla (TSLA) all were a drag on the index. Even Apple (AAPL), after unveiling new operating systems for their computers, phones and tablets, couldn’t impress investors enough to post gains on the day. The stock fell $4.35 to $628.65.
Meanwhile, gold prices still continues to trend downwards, dropping 0.2% to $1,243/oz. The metal has been slowly moving away from its 2014 high of almost $1,400/oz. and has not shown any apparent signs of regaining momentum.
Our 10 ETFs in the Spotlight went predominantly sideways; however, 4 of them made new highs today while 9 of them remain on the plus side YTD.
2. ETFs in the Spotlight
In case you missed the announcement and description of this section, you can read it here again.
It features 10 broadly diversified ETFs from my HighVolume list as posted every Monday. Furthermore, they are screened for the lowest MaxDD% number meaning they have been showing better resistance to temporary sell offs than all others over the past year.
In other words, none of them ever triggered their 7.5% sell stop level during this time period, which included a variety of severe market pullbacks but no move into outright bear market territory.
Here are the 10 candidates:
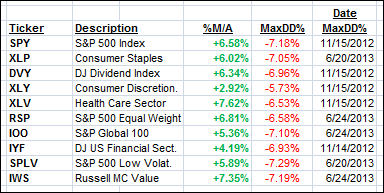
All of them are in “buy” mode, meaning their prices are above their respective long term trend lines by the percentage indicated (%M/A).
Year to date, here’s how the above candidates have fared so far:
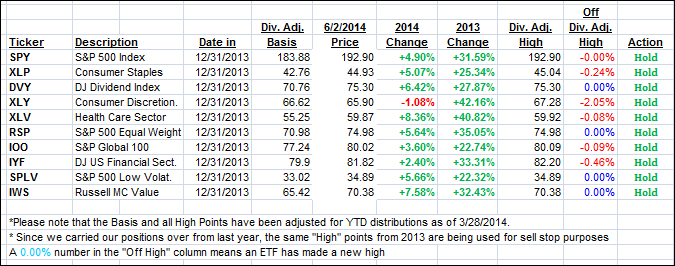
To be clear, the first table above shows the position of the various ETFs in relation to their respective long term trend lines (%M/A), while the second one tracks their trailing sell stops in the “Off High” column. The “Action” column will signal a “Sell” once the -7.5% point is taken out in the “Off High” column.
3. Domestic Trend Tracking Indexes (TTIs)
Our Trend Tracking Indexes (TTIs) went sideways and changed only insignificantly:
Domestic TTI: +3.06% (last close +3.15%)
International TTI: +4.30% (last close +4.21%)
Disclosure: I am obliged to inform you that I, as well as advisory clients of mine, own some of these listed ETFs. Furthermore, they do not represent a specific investment recommendation for you, they merely show which ETFs from the universe I track are falling within the guidelines specified.
Contact Ulli