
1. Moving The Markets
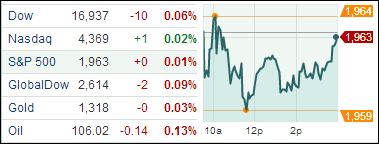
It was too tough for the markets to continue their record breaking trend this Monday, even though we received some positive data that showed an improving housing market. The S&P 500 dropped a tad and the Dow slid slightly. Only the Nasdaq finished the day in positive territory, squeezing out a 0.02% gain.
The main market moving activity today centered on corporate M&A news. The tech lovers out there heard today that Oracle (ORCL), the database and software giant, will buy MICROS Systems (MCRS) for $5.3 billion. We also received word today that GE made notable progress in their $17 bil quest to acquire French infrastructure giant Alstom (ALST).
Perhaps more interesting to those focused on the economy were the existing home sales numbers that came in today. A report was issued this morning that showed existing home sales rose for the second straight month in May. Existing home sales are up 4.9%, which is the best gain since mid-2011. Also, we heard that activity in China’s manufacturing sector in May rose to the highest level since December.
All of these are positive signs that the domestic and global economies are headed in the right direction. But, we all know how investor sentiment can sway from one day to the next regardless of positive economic numbers.
Our 10 ETFs in the Spotlight stayed about even with 1 of them making new highs today; 9 of them are still remaining on the plus side YTD.
2. ETFs in the Spotlight
In case you missed the announcement and description of this section, you can read it here again.
It features 10 broadly diversified ETFs from my HighVolume list as posted every Monday. Furthermore, they are screened for the lowest MaxDD% number meaning they have been showing better resistance to temporary sell offs than all others over the past year.
In other words, none of them ever triggered their 7.5% sell stop level during this time period, which included a variety of severe market pullbacks but no move into outright bear market territory.
Here are the 10 candidates:
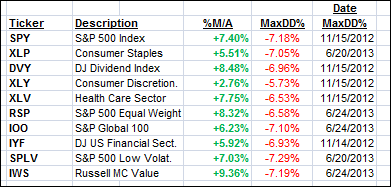
All of them are in “buy” mode, meaning their prices are above their respective long term trend lines by the percentage indicated (%M/A).
Year to date, here’s how the above candidates have fared so far:
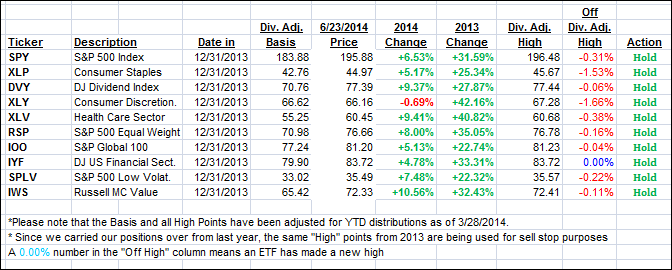
To be clear, the first table above shows the position of the various ETFs in relation to their respective long term trend lines (%M/A), while the second one tracks their trailing sell stops in the “Off High” column. The “Action” column will signal a “Sell” once the -7.5% point is taken out in the “Off High” column.
3. Domestic Trend Tracking Indexes (TTIs)
Our Trend Tracking Indexes (TTIs) retreated slightly on this predominantly sideways day:
Domestic TTI: +3.62% (last close +3.68%)
International TTI: +4.50% (last close +4.66%)
Disclosure: I am obliged to inform you that I, as well as advisory clients of mine, own some of these listed ETFs. Furthermore, they do not represent a specific investment recommendation for you, they merely show which ETFs from the universe I track are falling within the guidelines specified.
Contact Ulli