
ETF/No Load Fund Tracker Newsletter For June 6, 2014
ETF/No Load Fund Tracker StatSheet
————————————————————-
THE LINK TO OUR CURRENT ETF/MUTUAL FUND STATSHEET IS:
————————————————————
Market Commentary
Friday, June 6, 2014
STOCKS RIDE HIGH INTO FIRST WEEK OF SUMMER

1. Moving The Markets
Stocks ended the week on a high note, a record high note for that matter, with the overall markets gaining more than 1%. Equities have continued to trend upwards over the past couple of weeks, and this week was especially solid as markets were given a lift by decent global economic readings that suggest a continued improvement in the economy, monetary stimulus from the European Central Bank (ECB) to counter low inflation, and a positive U.S. jobs report.
Friday’s closely watched monthly payrolls report helped close out the week on a strong note. The Labor Department announced that employers had added 217,000 jobs in May, a healthy gain. Total U.S. payrolls have now surpassed the previous high reached in early 2008, prior to the financial crisis.
In the tech world, a big piece of M&A news came in today. Sprint (S) and T-Mobile (TMUS) have agreed to a merger that entails Sprint paying approximately $40/share, which implies a valuation of $32bil for T-mobile. With Sprint and T-mobile being the lower cost competitors in the market, it should be interesting to see how the merger will impact consumers. If the deal goes through and is approved by regulators, the Sprint-T-Mobile entity would have a share of about 30% of the U.S. wireless market.
Our 10 ETFs in the Spotlight joined the bulls and headed north; 8 of them made new highs today while all of them are now on the plus side YTD with the laggard, XLY, finally showing a green number.
2. ETFs in the Spotlight
In case you missed the announcement and description of this section, you can read it here again.
It features 10 broadly diversified ETFs from my HighVolume list as posted every Monday. Furthermore, they are screened for the lowest MaxDD% number meaning they have been showing better resistance to temporary sell offs than all others over the past year.
In other words, none of them ever triggered their 7.5% sell stop level during this time period, which included a variety of severe market pullbacks but no move into outright bear market territory.
Here are the 10 candidates:
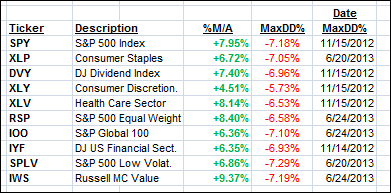
All of them are in “buy” mode, meaning their prices are above their respective long term trend lines by the percentage indicated (%M/A).
Year to date, here’s how the above candidates have fared so far:
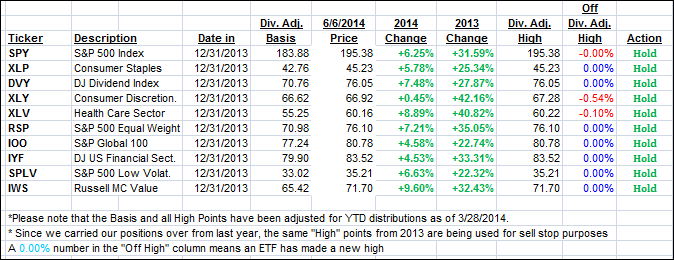
To be clear, the first table above shows the position of the various ETFs in relation to their respective long term trend lines (%M/A), while the second one tracks their trailing sell stops in the “Off High” column. The “Action” column will signal a “Sell” once the -7.5% point is taken out in the “Off High” column.
3. Domestic Trend Tracking Indexes (TTIs)
Our Trend Tracking Indexes (TTIs) both headed higher and deeper into bullish territory:
Domestic TTI: +3.55% (last Friday +3.15%)
International TTI: +4.85% (last Friday +4.21%)
Have a great weekend.
Ulli…
Disclosure: I am obliged to inform you that I, as well as advisory clients of mine, own some of these listed ETFs. Furthermore, they do not represent a specific investment recommendation for you, they merely show which ETFs from the universe I track are falling within the guidelines specified.
————————————————————-
READER Q & A FOR THE WEEK
All Reader Q & A’s are listed at our web site!
Check it out at:
http://www.successful-investment.com/q&a.php
A note from reader Jason:
Q: Ulli: Could you please clarify the difference between your M-Index and the momentum numbers as posted in your Monday Cutline reports? I find this information very valuable.
A: Jason: The M-Index is the ranking based on all momentum numbers and shows how funds/ETFs rank comparatively. The Cutline position numbers are simply showing the positions a fund/ETF has relative to its cutline or trend line.
For example, the first one above the yellow cutline has the position +1, the next one above it +2 and so on. The same applies below the cutline. As time goes on, you can quickly determine which funds are bouncing around the cutline and which ones are developing upside momentum by steadily climbing higher and developing positive momentum numbers.
———————————————————-
WOULD YOU LIKE TO HAVE YOUR INVESTMENTS PROFESSIONALLY MANAGED?
Do you have the time to follow our investment plans yourself? If you are a busy professional who would like to have his portfolio managed using our methodology, please contact me directly or get more details at:
https://theetfbully.com/personal-investment-management/
———————————————————
Back issues of the ETF/No Load Fund Tracker are available on the web at:
https://theetfbully.com/newsletter-archives/
Contact Ulli