
1. Moving The Markets
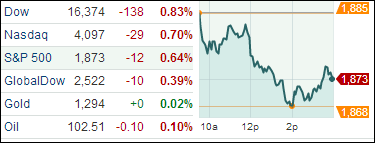
Markets finished the day all covered in red, with the indexes retreating as the chart above shows. All 10 primary S&P 500 sector indexes fell, and nearly three-fourths of Nasdaq-listed names were down for the day.
Yesterday, I mentioned that there were still a few notable companies due for earnings reports this week. Well, Staples (SPLS) and TJX (TJX) reported today, and the results were disappointing to say the least; the effect of that news rippled across the broad spectrum of retail stocks and was responsible for pulling markets down today.
In the auto world, General Motors (GM) shares took a tumble after the company announced it is recalling another 2.6 million vehicles globally, raising the number of vehicles it has recalled so far this year to almost 15.4 million. And in tech news, Microsoft (MSFT) unveiled the Surface Pro 3 tablet at an event in New York today, as it attempts to fuel interest in its struggling tablet line amid increasing competition. The unveiling had little impact on the stock, which actually dropped 0.18% today.
Tomorrow, we will hear the latest Fed minutes, which should be interesting in that the U.S. economy remains forecast to continue growing.
Our 10 ETFs in the Spotlight slipped along with the indexes; 8 of them remain on the plus side YTD.
2. ETFs in the Spotlight
In case you missed the announcement and description of this section, you can read it here again.
It features 10 broadly diversified ETFs from my HighVolume list as posted every Monday. Furthermore, they are screened for the lowest MaxDD% number meaning they have been showing better resistance to temporary sell offs than all others over the past year.
In other words, none of them ever triggered their 7.5% sell stop level during this time period, which included a variety of severe market pullbacks but no move into outright bear market territory.
Here are the 10 candidates:
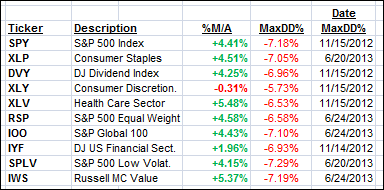
All of them, except XLY, are in “buy” mode, meaning their prices are above their respective long term trend lines by the percentage indicated (%M/A).
Year to date, here’s how the above candidates have fared so far:
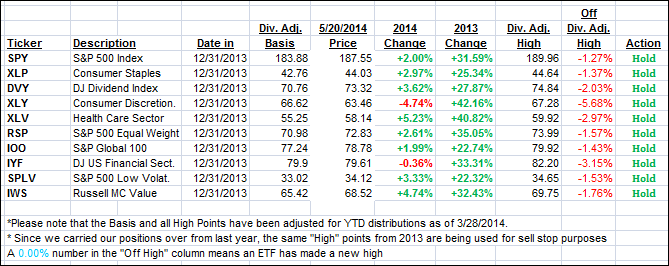
To be clear, the first table above shows the position of the various ETFs in relation to their respective long term trend lines (%M/A), while the second one tracks their trailing sell stops in the “Off High” column. The “Action” column will signal a “Sell” once the -7.5% point is taken out in the “Off High” column.
3. Domestic Trend Tracking Indexes (TTIs)
Our Trend Tracking Indexes (TTIs) pulled back and remain above their long-term trend lines by the following percentages:
Domestic TTI: +2.04% (last close +2.39%)
International TTI: +2.89% (last close +3.18%)
Disclosure: I am obliged to inform you that I, as well as advisory clients of mine, own some of these listed ETFs. Furthermore, they do not represent a specific investment recommendation for you, they merely show which ETFs from the universe I track are falling within the guidelines specified.
Contact Ulli