
1. Moving The Markets
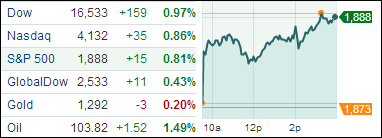
Major U.S. stock indexes mounted a solid comeback today; recovering their losses from the prior day and seeing the Dow log its largest gain in five weeks. As the chart above shows, all major indices gained nicely.
We heard the latest Fed minutes today, but surprisingly there was little reaction from investors, most likely because the minutes were in line with what had been expected; i.e. the economy is recovering but not enough to be considered ‘strong growth’.
Retail stocks, which were a big drag on the markets yesterday, shined bright like a diamond today with Tiffany & Co (TIF) jumping 9.1% after raising its full year profit forecast. After the steep drop in the sector yesterday, the retail sector gained back 1.2% today.
Investors will get a fresh batch of data on housing and the economy on Thursday, as well as earnings from Hewlett-Packard (HP), Best Buy (BBY) and Sears (SHLD), among others.
Our 10 ETFs in the Spotlight moved higher with 9 of them staying on the plus side YTD.
2. ETFs in the Spotlight
In case you missed the announcement and description of this section, you can read it here again.
It features 10 broadly diversified ETFs from my HighVolume list as posted every Monday. Furthermore, they are screened for the lowest MaxDD% number meaning they have been showing better resistance to temporary sell offs than all others over the past year.
In other words, none of them ever triggered their 7.5% sell stop level during this time period, which included a variety of severe market pullbacks but no move into outright bear market territory.
Here are the 10 candidates:
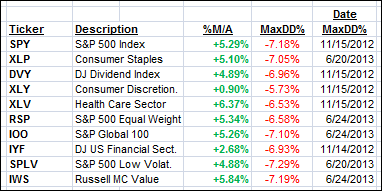
All of them, are in “buy” mode, meaning their prices are above their respective long term trend lines by the percentage indicated (%M/A).
Year to date, here’s how the above candidates have fared so far:
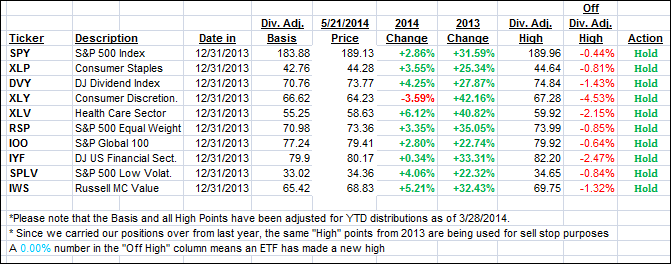
To be clear, the first table above shows the position of the various ETFs in relation to their respective long term trend lines (%M/A), while the second one tracks their trailing sell stops in the “Off High” column. The “Action” column will signal a “Sell” once the -7.5% point is taken out in the “Off High” column.
3. Domestic Trend Tracking Indexes (TTIs)
Our Trend Tracking Indexes (TTIs) joined the rollercoaster ride of the past few trading days and headed deeper into bullish territory:
Domestic TTI: +2.40% (last close +2.04%)
International TTI: +3.39% (last close +2.89%)
Disclosure: I am obliged to inform you that I, as well as advisory clients of mine, own some of these listed ETFs. Furthermore, they do not represent a specific investment recommendation for you, they merely show which ETFs from the universe I track are falling within the guidelines specified.
Contact Ulli