
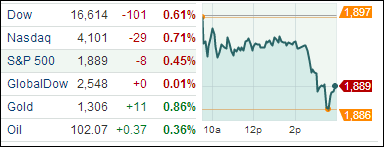
1. Moving The Markets
Clearly, the markets were taking a breather today, after the S&P’s attempt to pierce the 1,900 level, not just on an intra-day basis, did not materialize. While the benchmark had been trending sideways for this month, let’s not forget that it has been on a 4.5% rebound spree since its low on April 11.
Yesterday’s retails sales report showing a meager climb of 0.1% last month confirming what we have observed in our spotlight ETFs for some time; namely that consumer discretionaries (XLY) have been lagging the market all year and are not the place to be invested in.
Small-Caps have taken the brunt of the pullback with the Russell 2000 falling some 2.7% over the past 2 days, after having come off its March high by 8.7%, and also dropping below its widely followed 200-day moving average. It’s too early to tell if this is a harbinger of things to come, kind of like the proverbial canary in the coalmine. This where the long-term trends, along with trend line breaks, will be extremely helpful and eliminate the guessing game as to future market direction.
Our 10 ETFs in the Spotlight pulled back; no new highs were made, but 9 of them are remaining on the plus side YTD.
2. ETFs in the Spotlight
In case you missed the announcement and description of this section, you can read it here again.
It features 10 broadly diversified ETFs from my HighVolume list as posted every Monday. Furthermore, they are screened for the lowest MaxDD% number meaning they have been showing better resistance to temporary sell offs than all others over the past year.
In other words, none of them ever triggered their 7.5% sell stop level during this time period, which included a variety of severe market pullbacks but no move into outright bear market territory.
Here are the 10 candidates:
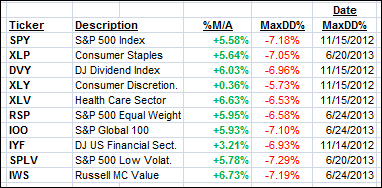
All of them are in “buy” mode, meaning their prices are above their respective long term trend lines by the percentage indicated (%M/A).
Year to date, here’s how the above candidates have fared so far:
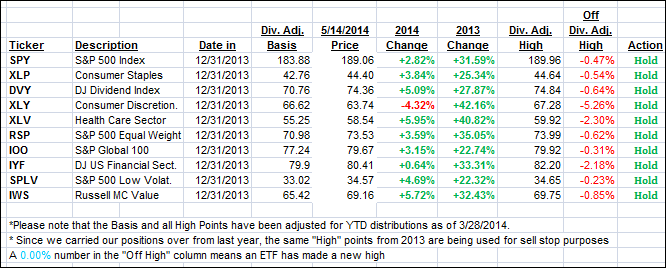
To be clear, the first table above shows the position of the various ETFs in relation to their respective long term trend lines (%M/A), while the second one tracks their trailing sell stops in the “Off High” column. The “Action” column will signal a “Sell” once the -7.5% point is taken out in the “Off High” column.
3. Domestic Trend Tracking Indexes (TTIs)
Our Trend Tracking Indexes (TTIs) were mixed and closed as follows:
Domestic TTI: +2.41% (last close +2.61%)
International TTI: +3.71% (last close +3.65%)
Disclosure: I am obliged to inform you that I, as well as advisory clients of mine, own some of these listed ETFs. Furthermore, they do not represent a specific investment recommendation for you, they merely show which ETFs from the universe I track are falling within the guidelines specified.
Contact Ulli