
1. Moving The Markets
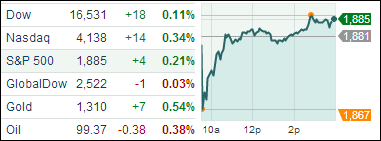
Stocks rebounded today after a shaky start this morning. All three major indexes finished in positive territory, with the Nasdaq leading the way up as the chart above shows. Earnings season is winding down, but Target (TGT) announced today that their CEO, Gregg Steinhafel, has resigned from the position effective immediately and turned over the reins to CFO John Mulligan. Shares dropped 3% today on the news. Many across the U.S. were calling for Steinhafel’s resignation shortly after the data breach that occurred during the holiday season. It shall be interesting to see who will be willing to step into the “hot seat” as CEO.
Apple (AAPL) regained ground today as its shares closed above the $600 mark for the first time since October of 2012. The stock has been performing relatively well since the company recently announced that a 7-for-1 stock split will take effect in early June.
European markets finished lower amidst continued worries over tensions in Ukraine, and Asian markets ended the day in mixed fashion as China reported contracting monthly manufacturing numbers.
Our 10 ETFs in the Spotlight inched higher, although no new highs were made new highs and 9 of them remain on the plus side YTD.
2. ETFs in the Spotlight
In case you missed the announcement and description of this section, you can read it here again.
It features 10 broadly diversified ETFs from my HighVolume list as posted every Monday. Furthermore, they are screened for the lowest MaxDD% number meaning they have been showing better resistance to temporary sell offs than all others over the past year.
In other words, none of them ever triggered their 7.5% sell stop level during this time period, which included a variety of severe market pullbacks but no move into outright bear market territory.
Here are the 10 candidates:
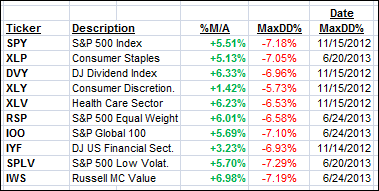
All of them are in “buy” mode, meaning their prices are above their respective long term trend lines by the percentage indicated (%M/A).
Year to date, here’s how the above candidates have fared so far:
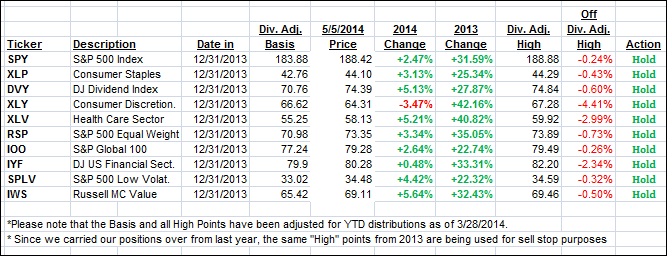
To be clear, the first table above shows the position of the various ETFs in relation to their respective long term trend lines (%M/A), while the second one tracks their trailing sell stops in the “Off High” column. The “Action” column will signal a “Sell” once the -7.5% point is taken out in the “Off High” column.
3. Domestic Trend Tracking Indexes (TTIs)
Our Trend Tracking Indexes (TTIs) barely changed but remain above their respective long-term trend lines by the following percentages:
Domestic TTI: +2.52% (last close +2.42%)
International TTI: +3.64% (last close +3.61%)
Disclosure: I am obliged to inform you that I, as well as advisory clients of mine, own some of these listed ETFs. Furthermore, they do not represent a specific investment recommendation for you, they merely show which ETFs from the universe I track are falling within the guidelines specified.
Contact Ulli