
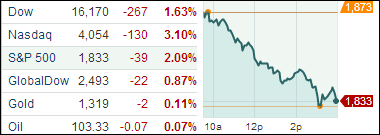
1. Moving The Markets
What a difference a day makes. After the markets fell in love with yesterday’s Fed minutes, which caused a nice rebound rally, today it was back to reality as the major indexes reversed affected by the same suspects during the last sell off, namely technology and biotech sectors with IBB losing 5.61%. Suddenly, evaluations were seen as being a little on the frothy side.
Yesterday’s winners, like Facebook and Google, got hammered today as they dropped 5.21% and 3.59% respectively while the Nasdaq suffered its worst day since late 2011. In terms of technical weakness, it’s worth noting that the S&P knifed through its widely followed 50-day moving average by -0.27%.
Starting the day on a negative tone were poor trade data from China, which pushed concerns about a slowing global demand back on the front burner. The only positive of the day was a jobless claims report showing that new applications for unemployment benefits dropped to the lowest level in some 7 years. That’s an indication of an improving US Labor market, which is good news but interpreted as bad news when comes to the continuation of the Fed’s QE program along with the hope of forever low interest rates.
Our 10 ETFs in the Spotlight headed south as well but 6 of them are remaining on the positive side YTD. No sell stops were triggered and no trend lines were crossed to the downside.
2. ETFs in the Spotlight
In case you missed the announcement and description of this section, you can read it here again.
It features 10 broadly diversified ETFs from my HighVolume list as posted every Monday. Furthermore, they are screened for the lowest MaxDD% number meaning they have been showing better resistance to temporary sell offs than all others over the past year.
In other words, none of them ever triggered their 7.5% sell stop level during this time period, which included a variety of severe market pullbacks but no move into outright bear market territory.
Here are the 10 candidates:
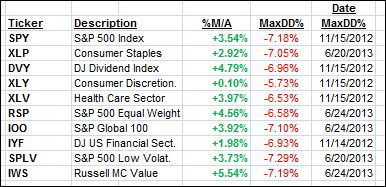
All of them are in “buy” mode meaning their prices are above their respective long term trend lines by the percentage indicated (%M/A).
Year to date, here’s how the above candidates have fared so far:
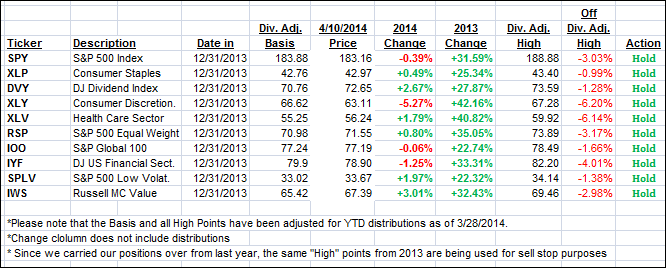
To be clear, the first table above shows the position of the various ETFs in relation to their respective long term trend lines (%M/A), while the second one tracks their trailing sell stops in the “Off High” column.
3. Domestic Trend Tracking Indexes (TTIs)
Our Trend Tracking Indexes (TTIs) reversed from yesterday’s upswing and closed as follows:
Domestic TTI: +1.80% (last close +2.89%)
International TTI: +2.70% (last close +4.30%)
Disclosure: I am obliged to inform you that I, as well as advisory clients of mine, own some of these listed ETFs. Furthermore, they do not represent a specific investment recommendation for you, they merely show which ETFs from the universe I track are falling within the guidelines specified.
Contact Ulli