
1. Moving The Markets
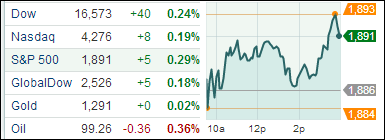
Stocks ended the day in positive territory for the fourth straight day on Wednesday, driven largely by positive economic reports on employment. The S&P 500 closed at a new record high of 1,890.90, while the Dow and Nasdaq closed up 0.24% and 0.20% respectively. The report released by the ADP showed that U.S. private employers added 191,000 workers in March, which was a big rebound from the past two months where job growth averaged 150,000. Investors are now anxiously awaiting the monthly government jobs report, which is due this Friday.
In corporate news, Google (GOOG) announced a stock-split that will take place tomorrow. Owners of Google Class A shares — ticker symbol GOOG through Wednesday — will get an equal number of new Class C shares. Those Class C shares will get the GOOG symbol, while the Class A shares will trade under the symbol GOOGL. Google shares closed on Wednesday at $1,135.10. Trading on a when-issued basis, the new Class C shares closed at $567, and the new Class A shares closed at $568.07.
In other corporate news, MannKind (MKND) surged more than 80% today to $6.99 after an advisory committee to the U.S. health regulator recommended approval for the drug-maker’s inhaled insulin treatment for diabetes. Also, General Motors (GM) remains under fire after the automaker announced earlier this week that it was recalling an additional 1.5 million vehicles due to faulty power steering problems that have caused more than 13 fatal accidents.
Our 10 ETFs in the Spotlight inched higher with 7 of them making new highs today; 9 of them are now on the plus side YTD.
2. ETFs in the Spotlight
In case you missed the announcement and description of this section, you can read it here again.
It features 10 broadly diversified ETFs from my HighVolume list as posted every Monday. Furthermore, they are screened for the lowest MaxDD% number meaning they have been showing better resistance to temporary sell offs than all others over the past year.
In other words, none of them ever triggered their 7.5% sell stop level during this time period, which included a variety of severe market pullbacks but no move into outright bear market territory.
Here are the 10 candidates:
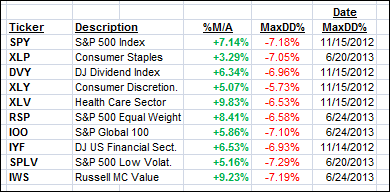
All of them are in “buy” mode meaning their prices are above their respective long term trend lines by the percentage indicated (%M/A).
Year to date, here’s how the above candidates have fared so far:
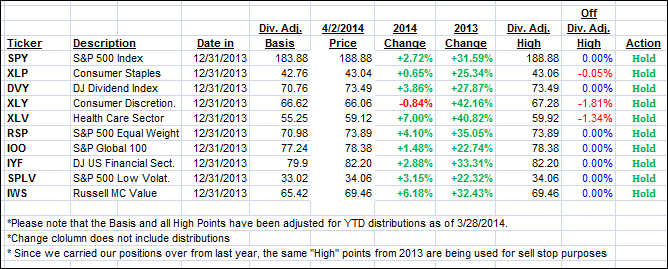
To be clear, the first table above shows the position of the various ETFs in relation to their respective long term trend lines (%M/A), while the second one tracks their trailing sell stops in the “Off High” column.
3. Domestic Trend Tracking Indexes (TTIs)
Our Trend Tracking Indexes (TTIs) edged higher and closed as follows:
Domestic TTI: +3.43% (last close +3.40%)
International TTI: +4.82% (last Friday +4.70%)
Disclosure: I am obliged to inform you that I, as well as advisory clients of mine, own some of these listed ETFs. Furthermore, they do not represent a specific investment recommendation for you, they merely show which ETFs from the universe I track are falling within the guidelines specified.
Contact Ulli