
1. Moving The Markets
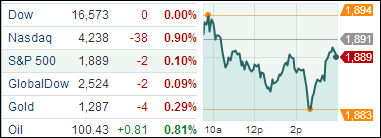
The S&P 500 index fell 0.1 %, staying near its all-time high of 1,890 that it posted a day earlier. The Dow broke even, and the Nasdaq composite fell 0.9% due to poor biotech performance and a selloff of recent “momentum” stocks.
Among the big momentum Nasdaq stocks that fell were Tesla Motors (TSLA) by 2.1%, Netflix Inc (NFLX) dropped 2.3% and Facebook (FB) shares fell 5.2%.
The Google split did in fact commence today. So, the S&P 500 now consists of 501 stocks, with the index including both Google Inc’s Class A (GOOGL) and Class C (GOOG) shares after the company’s special dividend. Google’s Class A shares rose 0.6% to $571.50 while its Class C shares gained 0.5% to $569.74.
On the economic front, a survey showed that U.S. service firms increased their business more quickly last month as new orders rose. Separate reports earlier in the week had shown manufacturing strengthening, hiring picking up, and sales of cars and trucks rising. The news came ahead of the government’s monthly jobs report, which will be published Friday and is keeping investors anxious. Overall, analysts expect to see a strong pickup in hiring.
Some of our 10 ETFs in the Spotlight edged higher today with 3 of them making new highs; 9 of them are now on the plus side YTD.
2. ETFs in the Spotlight
In case you missed the announcement and description of this section, you can read it here again.
It features 10 broadly diversified ETFs from my HighVolume list as posted every Monday. Furthermore, they are screened for the lowest MaxDD% number meaning they have been showing better resistance to temporary sell offs than all others over the past year.
In other words, none of them ever triggered their 7.5% sell stop level during this time period, which included a variety of severe market pullbacks but no move into outright bear market territory.
Here are the 10 candidates:
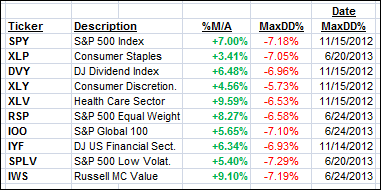
All of them are in “buy” mode meaning their prices are above their respective long term trend lines by the percentage indicated (%M/A).
Year to date, here’s how the above candidates have fared so far:
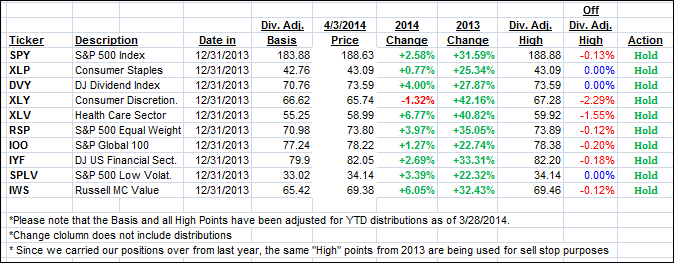
To be clear, the first table above shows the position of the various ETFs in relation to their respective long term trend lines (%M/A), while the second one tracks their trailing sell stops in the “Off High” column.
3. Domestic Trend Tracking Indexes (TTIs)
Our Trend Tracking Indexes (TTIs) backed off a little and closed as follows:
Domestic TTI: +3.24% (last close +3.43%)
International TTI: +4.75% (last Friday +4.82%)
Disclosure: I am obliged to inform you that I, as well as advisory clients of mine, own some of these listed ETFs. Furthermore, they do not represent a specific investment recommendation for you, they merely show which ETFs from the universe I track are falling within the guidelines specified.
Contact Ulli