
1. Moving The Markets
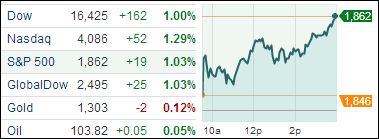
U.S. markets are up for a third day in a row. Investors drove stock prices to their highest level in a week today, encouraged by a crop of corporate earnings and reassuring U.S. and Chinese economic data.
Yahoo (YHOO) presented the public with a positive earnings report late Tuesday that ignited big trading volumes and resulted in large gains for the stock today. The company reported that it is making most of its money from its stakes in two Asian Internet companies: China’s Alibaba Group and Yahoo Japan, which both had surges in revenue growth for Q4 2013.
Equities also responded well today to various other reports on the state of the U.S. and China economies. We received information today from China that said their economy grew 7.4% from Q1 2013 and a report that U.S. factory production was up for Q1 2014. Both numbers beat analyst expectations and are positive signs of continued domestic and global economic growth.
Our 10 ETFs in the Spotlight headed higher with one of them still remaining below its long term trend line; however, 3 made new highs and 9 are now in the green YTD.
2. ETFs in the Spotlight
In case you missed the announcement and description of this section, you can read it here again.
It features 10 broadly diversified ETFs from my HighVolume list as posted every Monday. Furthermore, they are screened for the lowest MaxDD% number meaning they have been showing better resistance to temporary sell offs than all others over the past year.
In other words, none of them ever triggered their 7.5% sell stop level during this time period, which included a variety of severe market pullbacks but no move into outright bear market territory.
Here are the 10 candidates:
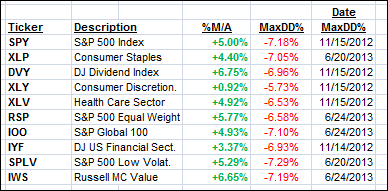
All of them are in “buy” mode, with the exception of XLY, meaning their prices are above their respective long term trend lines by the percentage indicated (%M/A).
Year to date, here’s how the above candidates have fared so far:
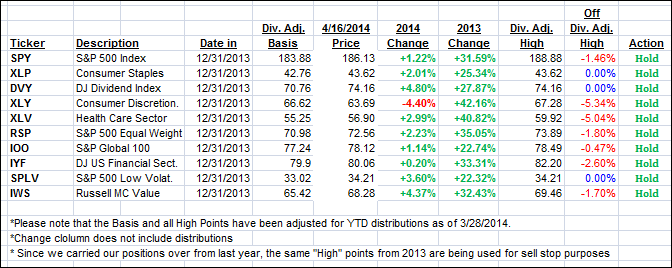
To be clear, the first table above shows the position of the various ETFs in relation to their respective long term trend lines (%M/A), while the second one tracks their trailing sell stops in the “Off High” column. The “Action” column will signal a “Sell” once the -7.5% point is taken out in the “Off High” column.
3. Domestic Trend Tracking Indexes (TTIs)
Our Trend Tracking Indexes (TTIs) improved by moving deeper into bullish territory and closed the day as follows:
Domestic TTI: +2.31% (last close +1.82%)
International TTI: +3.08% (last close +2.22%)
Disclosure: I am obliged to inform you that I, as well as advisory clients of mine, own some of these listed ETFs. Furthermore, they do not represent a specific investment recommendation for you, they merely show which ETFs from the universe I track are falling within the guidelines specified.
Contact Ulli