
ETF/No Load Fund Tracker Newsletter For April 11, 2014
ETF/No Load Fund Tracker StatSheet
————————————————————-
THE LINK TO OUR CURRENT ETF/MUTUAL FUND STATSHEET IS:
————————————————————
Market Commentary
Friday, April 11, 2014
MARKETS CONTINUE TO SLIDE; TTIs ARE STILL ON THE BULLISH SIDE
1. Moving The Markets
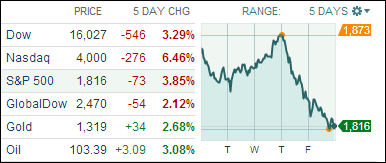
The recent volatility of the market did not end the week in favor of the bulls. The ‘high momentum’ and tech stocks that I have been reporting on over the past two weeks continued to be the culprit of the market’s continued slide, with bank stocks such as JPMorgan Chase (JPM) adding additional troubles to the mix. All major indexes slipped as the 5-day chart above shows, and the Nasdaq tanked 1.34% officially dropping below 4,000 for the first time since February.
Of course, given the slide in equities, the U.S. bond market rallied this week on renewed safe-haven bids as well as relief buying in reaction to the release of minutes from the Federal Reserve’s March 18-19 policy meeting. The intense appetite for bonds spread into this week’s auction of $64 billion worth of longer-term debt, which raised $13.5 billion in new cash for the federal government.
While the market pullback this week may have you worried, those who have been in the game long enough are shrugging it off as irrational overreaction. That is fine, but what is more important is the fact that this bull market may come to an end. As I have pounced on before, this is where the rubber meets the road and, if you are following long-term trends, the time will come when it’s wise to move to the safety of the sidelines. We have not reached that point yet, but you sure don’t want to participate in another bear disaster a la 2008 or worse. Have your sell stops ready and be prepared to execute when the time comes. I sure will.
The final nail in the coffin may very well come next week when the Chinese government releases its Q1 2014 growth figures. Underperforming numbers could have an impact on equities here in the U.S.
Our 10 ETFs in the Spotlight dropped as well with one of them breaking its long term trend line into bearish territory; only 4 of them remain positive YTD. Our Trend Tracking Indexes (TTIs) are still hovering on the bullish side as the tables below show:
2. ETFs in the Spotlight
In case you missed the announcement and description of this section, you can read it here again.
It features 10 broadly diversified ETFs from my HighVolume list as posted every Monday. Furthermore, they are screened for the lowest MaxDD% number meaning they have been showing better resistance to temporary sell offs than all others over the past year.
In other words, none of them ever triggered their 7.5% sell stop level during this time period, which included a variety of severe market pullbacks but no move into outright bear market territory.
Here are the 10 candidates:
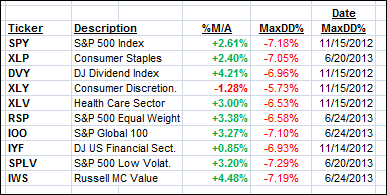
All of them are in “buy” mode, with the exception of XLY, meaning their prices are above their respective long term trend lines by the percentage indicated (%M/A).
Year to date, here’s how the above candidates have fared so far:
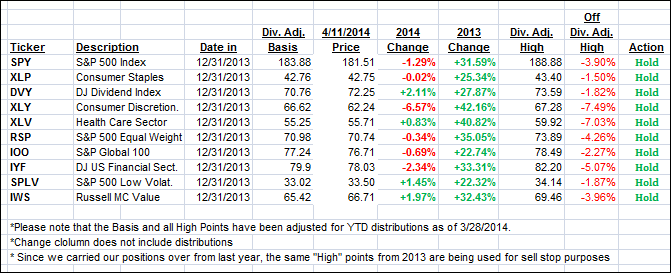
To be clear, the first table above shows the position of the various ETFs in relation to their respective long term trend lines (%M/A), while the second one tracks their trailing sell stops in the “Off High” column. The “Action” column will signal a “Sell” once the -7.5% point is taken out in the “Off High” column.
3. Domestic Trend Tracking Indexes (TTIs)
Our Trend Tracking Indexes (TTIs) headed south and closed as follows:
Domestic TTI: +1.17% (last Friday +2.31%)
International TTI: +1.80% (last Friday +3.74%)
Have a great week.
Ulli…
Disclosure: I am obliged to inform you that I, as well as advisory clients of mine, own some of these listed ETFs. Furthermore, they do not represent a specific investment recommendation for you, they merely show which ETFs from the universe I track are falling within the guidelines specified.
————————————————————-
READER Q & A FOR THE WEEK
All Reader Q & A’s are listed at our web site!
Check it out at:
http://www.successful-investment.com/q&a.php
A note from reader Julie:
Q: Ulli: With the markets being this jittery, I believe that your TTIs could break their trend lines to the downside at some time generating a “Sell.” Could please clarify (again) what areas would be affected by such a move? Thank you.
A: Julie: Sure. A “Sell” for the Domestic TTI includes all “broadly diversified domestic equity mutual funds/ETFs.” A “Sell” for the International TTI covers all “broadly diversified international equity mutual funds/ETFs.”
From past experience, I can tell you that before such a major trend line break occurs most of our holdings will have been sold as the trailing sell stops tend to kick in way before the trend line breaks.
Bond Funds, Sector funds and Country funds are not included and should be liquidated based on their own respective sell stops and/or trend line breaks.
———————————————————-
WOULD YOU LIKE TO HAVE YOUR INVESTMENTS PROFESSIONALLY MANAGED?
Do you have the time to follow our investment plans yourself? If you are a busy professional who would like to have his portfolio managed using our methodology, please contact me directly or get more details at:
https://theetfbully.com/personal-investment-management/
———————————————————
Back issues of the ETF/No Load Fund Tracker are available on the web at:
https://theetfbully.com/newsletter-archives/
Contact Ulli