
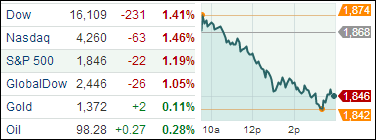
1. Moving The Markets
It was not a good day for U.S. stocks as they fell broadly today, with the Dow and S&P 500 suffering their worst day of trading since early February. The blame is being put on rising concerns over Ukraine and Russia, as well as new indications of a slowdown in China. China’s economy slowed markedly in the first two months of the year, as growth in investment, retail sales and factory output all fell to multi-year lows. The stream of lackluster Chinese data continues. Figures overnight showed Chinese industrial output in January-February rose 8.6% from a year earlier but was down from 9.7% in December. Retail sales for the same period were also higher, but failed to meet expectations.
The Ukraine and Russia standoff is not helping markets one bit. Lawmakers in Ukraine have voted unanimously to create a National Guard of 60,000 or more volunteers amid their worries that Russian troops have amassed themselves near the border between the two countries ahead of a Sunday referendum in Crimea on whether citizens want to join Russia. Plus, there was a rumor that Russia started shooting today. Remember that with markets at all-time highs there is heightened sensitivity to any piece of bad news.
While the international landscape seems a bit shaky, things are on the up and up here at home. U.S. retail sales rebounded in February and new filings for jobless benefits hit a fresh three-month low last week, suggesting the economy was regaining strength after an abrupt slowdown caused by severe weather.
Retail sales increased 0.3% last month, with receipts rising in most categories, the Commerce Department said. The gain followed a 0.6% drop in January and ended two straight months of declines. In a separate report today, the Labor Department said initial claims for state unemployment benefits dropped 9,000 to a seasonally adjusted 315,000 last week. That was the lowest reading since late November.
Our 10 ETFs in the Spotlight slipped with the indexes but 7 of them are currently showing gains YTD.
2. ETFs in the Spotlight
In case you missed the announcement and description of this section, you can read it here again.
It features 10 broadly diversified ETFs from my HighVolume list as posted every Monday. Furthermore, they are screened for the lowest MaxDD% number meaning they have been showing better resistance to temporary sell offs than all others over the past year.
In other words, none of them ever triggered their 7.5% sell stop level during this time period, which included a variety of severe market pullbacks but no move into outright bear market territory.
Here are the 10 candidates:
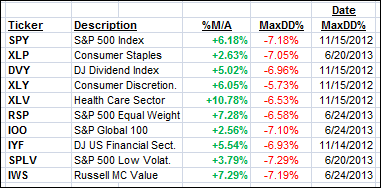
All of them are in “buy” mode meaning their prices are above their respective long term trend lines by the percentage indicated (%M/A).
Year to date, here’s how the above candidates have fared so far:
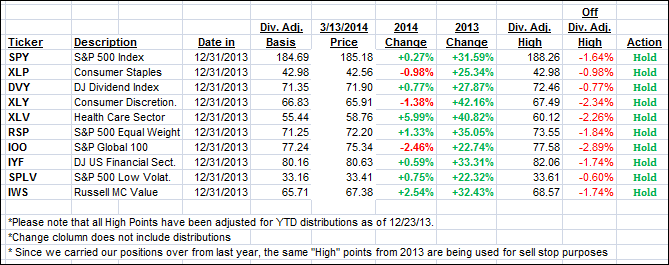
To be clear, the first table above shows the position of the various ETFs in relation to their respective long term trend lines (%M/A), while the second one tracks their trailing sell stops in the “Off High” column.
3. Domestic Trend Tracking Indexes (TTIs)
Our Trend Tracking Indexes (TTIs) headed lower and ended the day as follows:
Domestic TTI: +3.62% (last close +4.18%)
International TTI: +3.76% (last close +4.91%)
Disclosure: I am obliged to inform you that I, as well as advisory clients of mine, own some of these listed ETFs. Furthermore, they do not represent a specific investment recommendation for you, they merely show which ETFs from the universe I track are falling within the guidelines specified.
Contact Ulli