
1. Moving The Markets
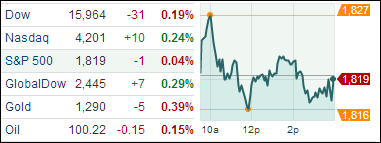
The markets here in the U.S. slipped back into the red zone across the board. The S&P 500 index fell half a point, the Dow Jones industrial average fell 0.2% and the Nasdaq composite rose 0.2%. Makers of consumer staples (XLP), a category that includes everyday products like soap, diapers and cigarettes, fell the most of the 10 sectors in the S&P 500.
The Senate’s approval suspending the debt limit became effective today as Obama signed on the dotted lines. This will allow the U.S. to meet its obligations until four months past after the next Congressional election at the end of 2014. This marks a victory for Obama and Democrats who refused to consider Republican demands to create a debt ceiling.
Treasuries fell today, pushing 10-year note yields to a two-week high. If you follow treasuries, you will know that the U.S. sold $24 billion of the securities today, just a day after Federal Reserve Chairman Janet Yellen said the central bank remains on course to taper bond purchases.
More market moving news is anticipated tomorrow as the Commerce Department’s Census Bureau will release its report on retail sales. Last month, the report indicated a 0.2% increase for December. This month, economists are expecting a 0.1% decline. The following week brings the report on housing starts and the February Flash Manufacturing PMI reading from Markit Economics. Reporting before markets open tomorrow are GNC Holdings (GNC), Molson Coors Brewing (TAP), Orbitz Worldwide (OWW), PepsiCo (PEP), Goodyear Tire & Rubber Co (GT) and Starwood Hotels & Resorts Worldwide (HOT).
Our 10 ETFs in the Spotlight changed only slightly with the exception of XLP, which is honing in on another break below its long-term trend line.
2. ETFs in the Spotlight
In case you missed the announcement and description of this section, you can read it here again.
It features 10 broadly diversified ETFs from my HighVolume list as posted every Monday. Furthermore, they are screened for the lowest MaxDD% number meaning they have been showing better resistance to temporary sell offs than all others over the past year.
In other words, none of them ever triggered their 7.5% sell stop level during this time period, which included a variety of severe market pullbacks but no move into outright bear market territory.
Here are the 10 candidates:
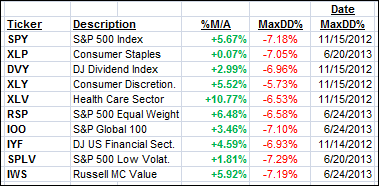
All of them have moved back into “buy” mode after this recent market hiccup meaning their prices are above their respective long term trend lines by the percentage indicated (%M/A).
Year to date, here’s how the above candidates have fared so far:
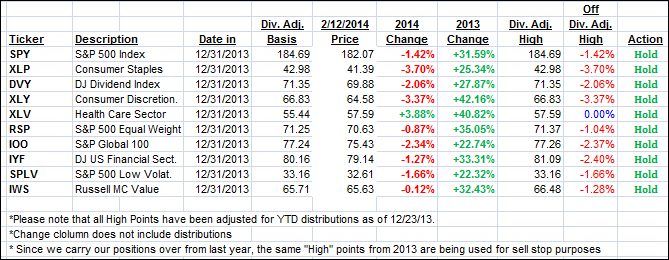
To be clear, the first table above shows the position of the various ETFs in relation to their respective long term trend lines (%M/A), while the second one tracks their trailing sell stops in the “Off High” column.
3. Domestic Trend Tracking Indexes (TTIs)
Our Trend Tracking Indexes (TTIs) meandered with the markets and closed as follows:
Domestic TTI: +2.98% (last close +3.00%)
International TTI: +5.41% (last close +5.14%)
Contact Ulli